Most people recognise the term “pay gap” as a measure of overall differences in mean or median earnings between two populations. For example, the gender pay gap is the difference between what men as a group earn on average vs. what women as a group earn on average, within a population. The most recent data from the Office of National Statistics found that the median gender pay gap for workers in the UK actually worsened — widening to 8.3% in 2022 (up from 7.7% in April 2021).
There are many contributors to the pay gap. Pay inequities are often the easiest and most natural place for organisations to start tackling their pay gap through statistical pay equity analyses and remediation. However, another key driver of the pay gap is the “opportunity gap.” In the context of a workplace, the opportunity gap is disproportionately limited access for certain groups — via hiring, promotions, or other forms of career advancement — to higher-paying roles such as those in management and leadership.
What does the opportunity gap look like in the UK and which groups are most affected? Below, we dig into the data to find out.
The gender opportunity gap in the UK
Across the UK among full-time workers, men are 38% more likely than women to be executives (defined as those in occupation code 111, i.e. Chief Executives and Senior Officials), and 35% more likely to be in management occupations (those in occupation code 1, excluding code 111). Though women are 41.4% of the full-time workforce, they represent only 33.8% of executives and 34.2% of managers.
The manager opportunity gap in the UK is very similar to the U.S. (where men are 34% more likely to be managers), but the gender opportunity gap for executives in the UK is less imbalanced than in in the U.S. (where men are 95% more likely than women to be executives). So on the surface, the UK is doing better than the U.S. on executive gender representation.
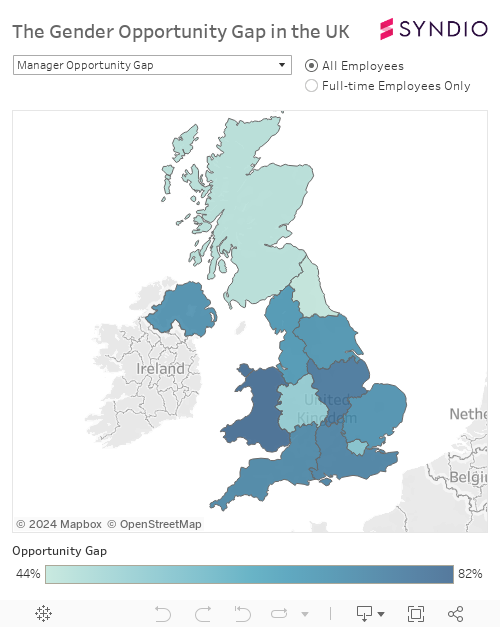
What is the UK gender opportunity gap by region?
However, there are significant regional differences in the gender opportunity gap in the UK. Wales has the smallest management opportunity gap for women (men are 18% more likely to be managers), while the East region has the largest (men are 51% more likely to be managers).
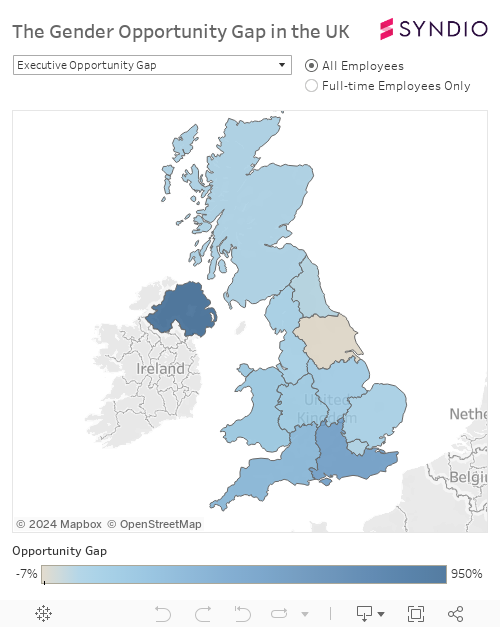
The executive opportunity gap has more geographic variation, even flipping in some cases. In certain regions, women make up 45% or more of executives while representing a slightly smaller proportion of the full-time labour force, making them more likely to be executives than men. The difference is most pronounced in the Northeast, where women are 80% more likely than men to be executives. In the East Midlands and South East, however, men are more than twice as likely to be executives than women.
Ethnic opportunity gaps in the UK
An analysis of occupations by ethnicity shows significant gaps, particularly for Black workers in the UK: They are 3.2% of the workforce, but only 1.4% of managers and senior officials. Combine this with the fact that white workers are slightly overrepresented among senior officials and we can see that white workers are 135% more likely to be managers and senior officials than Black workers. The next largest gaps are faced by non-Indian and non-Pakistani/Bangladeshi Asian workers (white workers are 49% more likely to be managers and senior officials), Pakistani/Bangladeshi workers (white workers are 33% more likely), and the “other” ethnicity catch-all group (white workers are 22% more likely). Indian and mixed race workers are roughly as likely as white workers to appear among managers and senior officials.
Note that these gaps are different to the ones shared above as we are unable to distinguish between executives and other managers in the publicly available occupation and ethnicity data in the UK. This aggregation may obscure differences in the likelihood of appearing in executive ranks. See the table below for the results.
| Ethnicity | % of All Workers | % of Managers & Senior Officials | Relative Likelihood of Being a Manager or Senior Official | Opportunity Gap (Relative to White Workers) |
|---|---|---|---|---|
| Black | 3.2% | 1.4% | 0.44 | 135% |
| Indian | 3.1% | 3.1% | 1.02 | 1% |
| Mixed | 1.5% | 1.6% | 1.07 | -4% |
| Other Asian | 1.9% | 1.3% | 0.69 | 49% |
| Other | 1.6% | 1.4% | 0.85 | 22% |
| Pakistani / Bangladeshi | 2.1% | 1.6% | 0.78 | 33% |
| White | 88.7% | 89.6% | 1.03 | 0% |
Methodology and data
To quantify the opportunity gap in the UK, we calculated the relative likelihood of men and women appearing in managerial and leadership roles using estimates of the demographic breakdown of the UK labour force from the Annual Population Survey. These data allow us to conduct a similar methodology to our U.S.-based opportunity gap study. For the ethnicity opportunity gap, occupational data were retrieved from this special ONS release. We limited our analysis to full-time workers to separate the fact that women are nearly three times more likely than men to work part-time. Including part-time workers in the analysis would show considerably larger opportunity gaps.
The opportunity gap shows how much more/less likely the majority group (i.e. men and white workers, depending on the gap) are to appear in the job category in question (i.e. executives or other managers) by comparing between groups the relative likelihood of appearing in executive or managerial positions.
The pay gap — not just about pay
Pay gaps are driven by both pay inequities and opportunity gaps. In addition to conducting pay equity analyses, companies that wish to close their median pay gap need to dig into the drivers of opportunity inequities in hiring, promotions, performance assessments, and retention, then implement policy change interventions. It’s a journey of progress over time, but purpose-built technology, such as Syndio’s OppEQ®, can provide a roadmap to set and achieve representation goals.
Want to learn more about pay gaps and opportunity gaps? Our webinar linked below shares how companies can move beyond pay to address the pay gap. You can also explore the infographic below to learn more about why opportunity equity matters and how to achieve it.