Does pay for performance work? In Syndio’s analysis of 158,403 U.S. employees at 46 Syndio customers, higher-rated employees do earn more: about 5 percent more base pay for each step up in rating, at the same company and job level. But the rating explains only a quarter of one percentage point of why one person earns more than another.
Both findings are true. Many companies say they pay for performance, and they built their systems in good faith to do exactly that. In this data, where you work, your job level, and your team explain far more of your pay than your rating does. That gap is the subject of our new paper, The Last Mile of Strategy: Pay Is Where Strategy Gets Tested.
Key takeaways
- A higher rating is worth about 5 percent more base pay, for people at the same company and job level.
- Employer and job level explain 71.5 percent of the differences in pay. The rating adds just 0.25 percentage points.
- In the median organization, about three in five employees get the same rating, “Meets Expectations.”
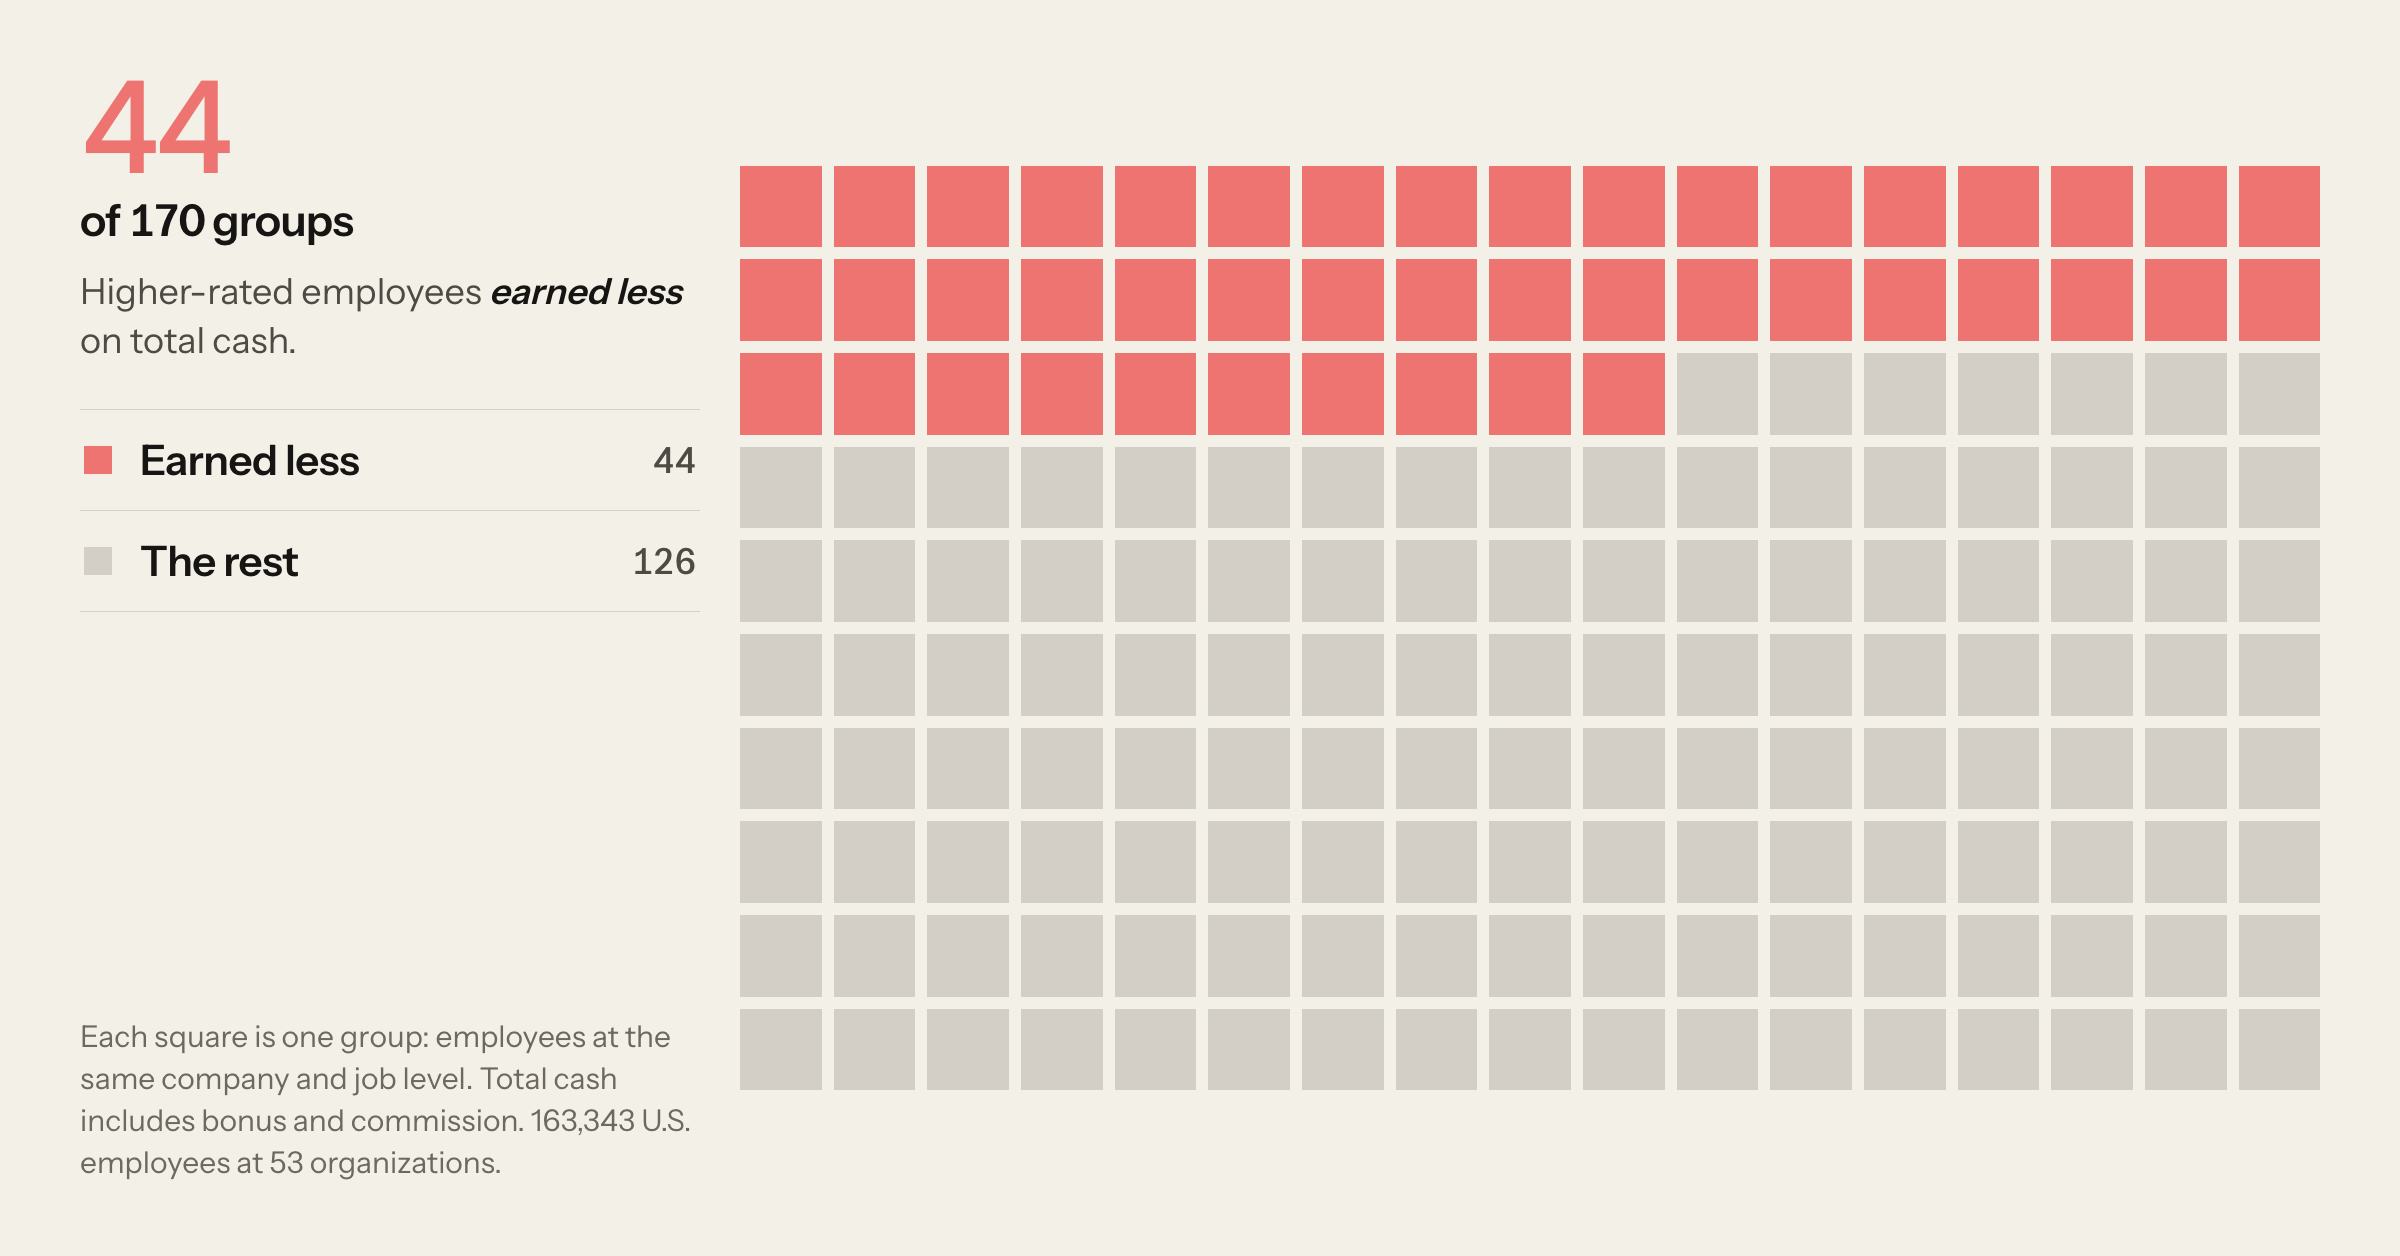
- In 16 percent of groups of people at the same company and job level, higher-rated employees earn less than lower-rated peers on base pay. On total cash, it is 26 percent.
- The fix is a pay decision people can follow, not a steeper curve.
What does pay for performance mean?
Pay for performance is the practice of paying people who contribute more value to the business more than people who contribute less. Merit raises and bonuses are the usual tools, and a performance rating is usually the input. The idea is simple. Whether it shows up in paychecks is a question each company can test with its own data.
What does Syndio data show about pay and performance?
We looked at base pay for 158,403 U.S. employees at 46 Syndio customers and asked how much of the difference between one person’s pay and another’s each factor explains. Here’s what we measured and the share of the difference in pay:
- Employer and job level: 71.5 percent
- Team and manager: Up to 18.2 percent (an upper bound)
- Performance rating: 0.25 percentage points, added after employee and job level
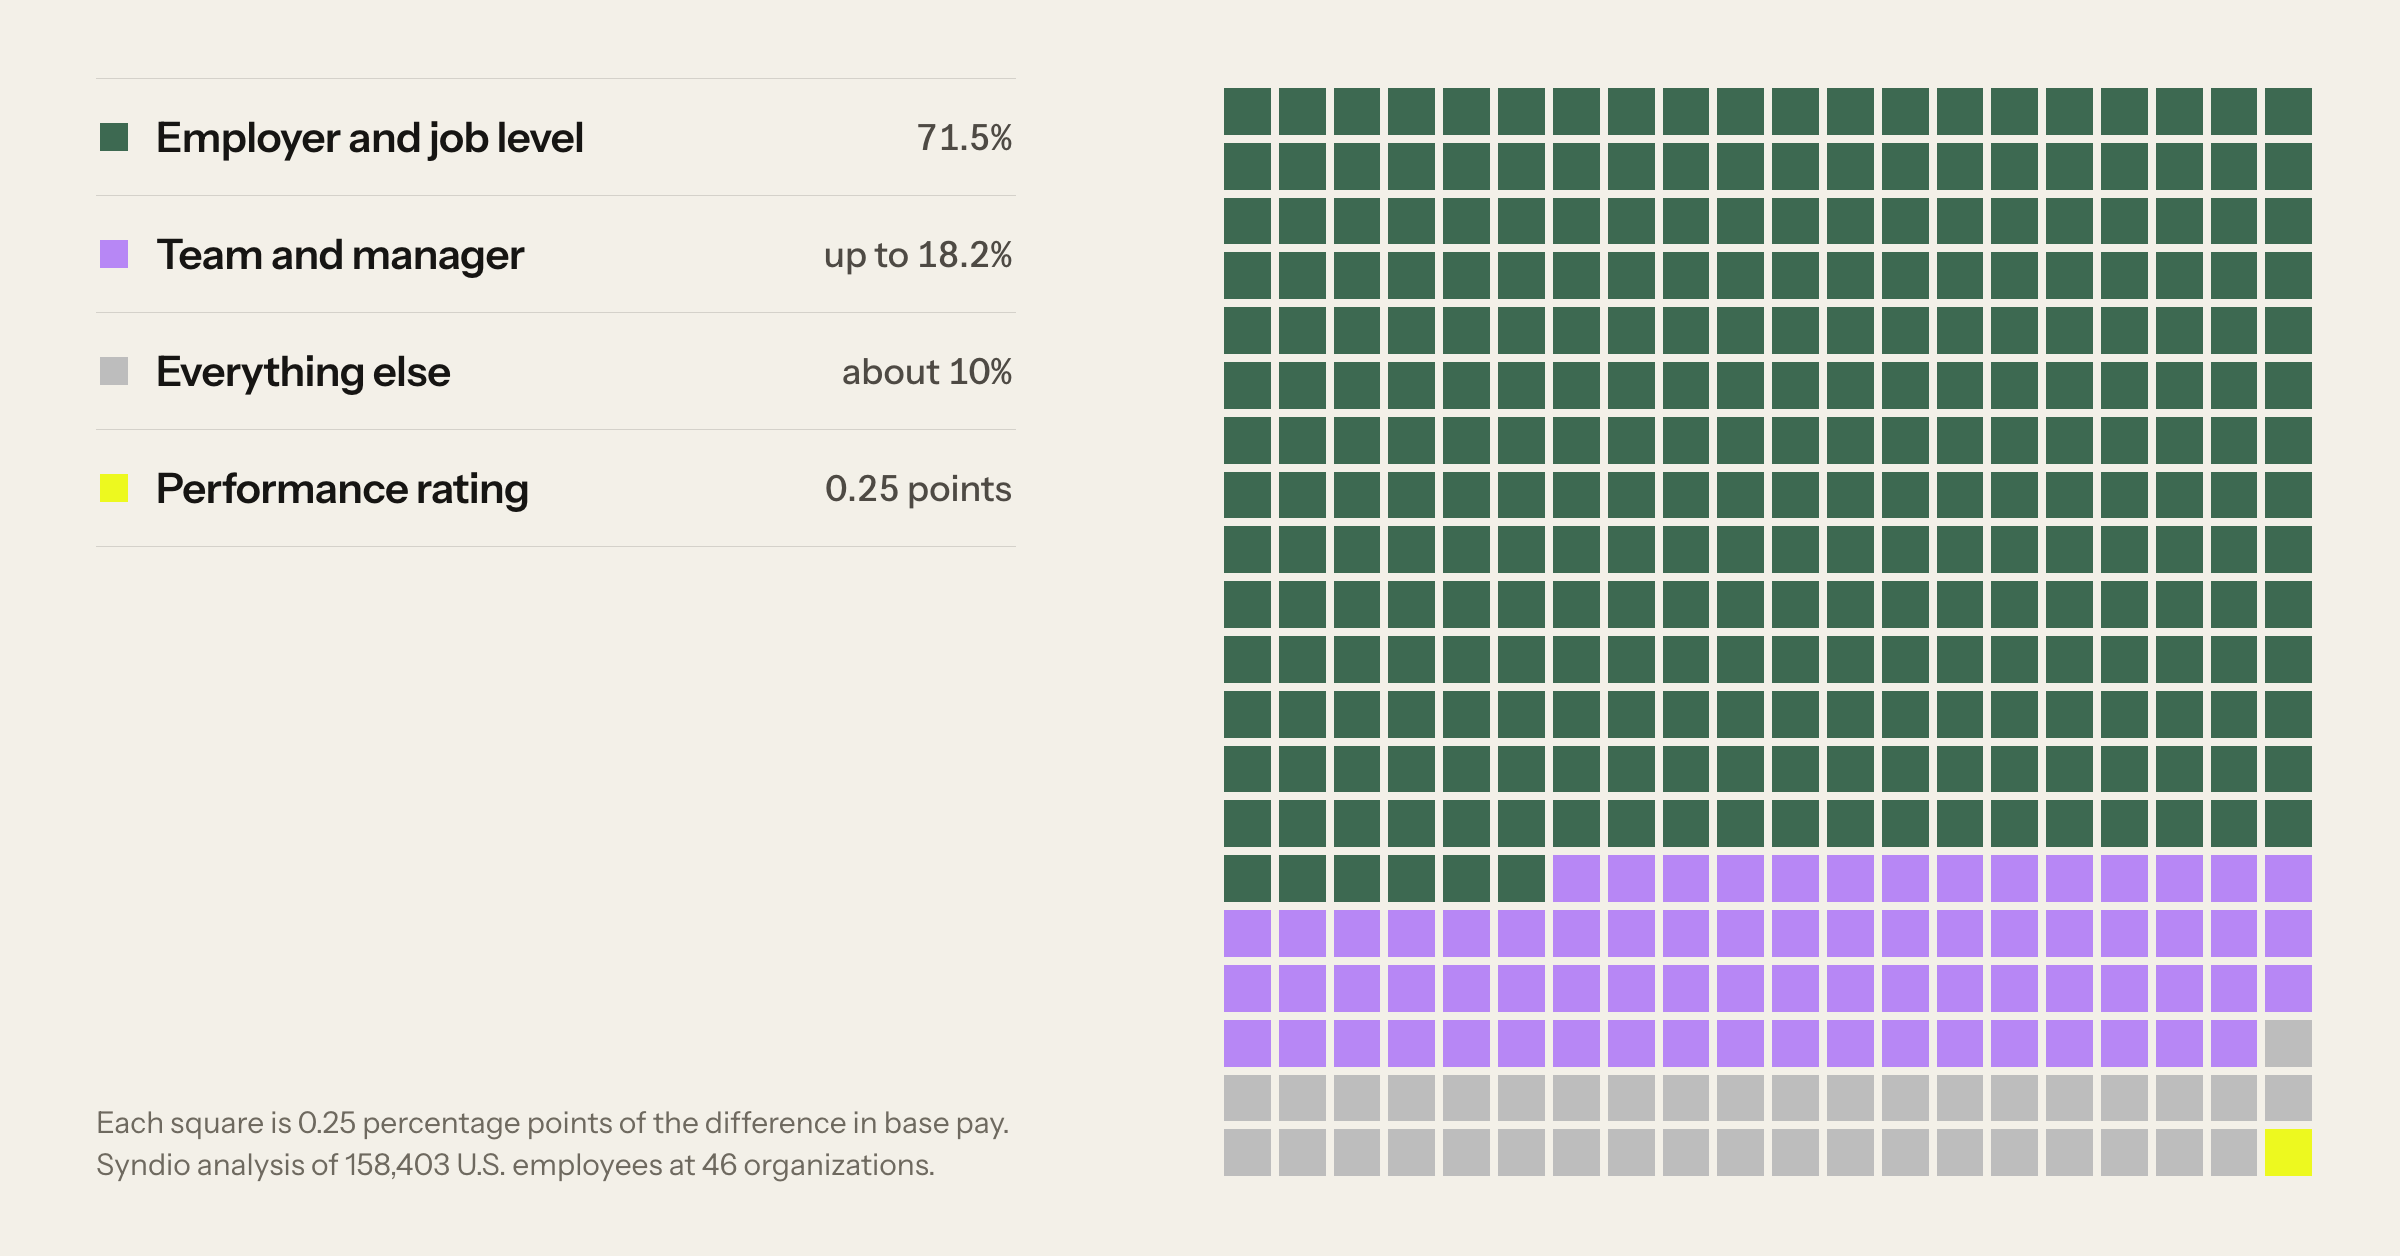
Take two people at the same company and job level. On average, the one rated a step higher earns about 5 percent more base pay. That difference is real. It is also small next to the gap between employers and between levels.
The data covers U.S. employees at Syndio customers at one point in time. It shows how pay and ratings line up today. It does not show what any rating did to any raise.
Why does a performance rating explain so little of pay?
There are three key reasons why a performance rating explains so little of employee pay.
Many people get the same rating. In the median organization, about three in five rated employees get the middle rating, “Meets Expectations.” In some organizations nearly everyone does. A rating can only explain differences in pay if ratings themselves differ.
Pay responds slowly. Merit budgets typically run 3 to 4 percent (WorldatWork, 2024) and are paid once a year, so even a strong rating earns a small raise, once a year.
Managers have reasons to rate this way. Rating one person higher means explaining it to everyone who was not, and the extra money has to come out of a merit pool that was sized before anyone was rated. Rating someone lower means a harder conversation and a real risk of losing them.
A salary is the sum of many years of raises. The rating shows up more in the raise than in the salary. In one study that followed managers over time, performance explained almost none of the differences in their salaries but correlated 0.65 with the size of their pay change (Heneman, 1973). That is why a snapshot of salaries understates the link between a rating and a raise.
Do bonuses close the gap?
Not in this data. Bonus and commission are designed to tie pay to ratings, so you would expect a stronger link in total cash. On total cash, employer and job level explain 65.0 percent of pay differences and the rating adds 0.12 points. That holds for the bonus a person was targeted to receive and the bonus actually paid.
A group here is the employees at one company in one job level. On total cash, higher-rated employees earned less than lower-rated peers in 26 percent of groups. Among groups of 200 or more employees, it is still 21.5 percent. On base pay alone, it is 16 percent.
Should companies make managers spread ratings out?
Some companies respond by telling managers to spread ratings out, such as a forced curve. The ratings then look more varied, but the manager can no longer explain why someone got a given rating, and a pay decision that cannot be explained does not hold up.
Removing ratings fails too: the bonus formula loses its input, and the people who used to earn more than target notice first. A rating was never the reason for a pay difference. It stands in for one, the manager’s judgment of the work.
What should leaders do instead?
Start with one decision, not the whole system. Before each pay decision goes out:
- Compare it to similar recent decisions.
- Make sure the manager can explain it to the employee on the day it is delivered.
- Write the reason down.
Capital requests typically need a stated reason, a comparison, an approval, and a record. Compensation decisions can be as large as capital requests, but they are often made in the merit tool, on a deadline, without a comparison or a written reason.
When the manager’s request is right, a decision made with comparison data in the moment is usually cheaper, and the company keeps the person. Whether a request was right can only be checked later if someone wrote down why it was made.
Here is what that looks like, as an illustration from the paper and not a customer. An engineer is paid $150,000. Their manager thinks they are worth $165,000 and asks for the $15,000. No one in the room can see what the company offered comparable engineers last quarter, so the answer is 3 percent, about $4,500. Six months later a competitor offers $172,000, and the company counters at $175,000 and approves it in a day. That’s a single employee, with three prices depending on the timing and context.
Also hold part of the merit budget back until ratings are in, so a manager who rates one more person higher does not pay for it out of the rest of the team’s raises.
Three questions to evaluate your own pay data
1 – Does pay rise with the rating? Inside each job level, compare average base salary across the rating steps. Then do the same for bonus.
2 – How many people sit in the middle? Count the share of rated employees at the middle rating, by organization and by function.
3 – How much of last year’s raises outside the merit cycle went to matching outside offers? Pull off-cycle base increases by reason code, promotions excluded. If the reason field was never filled in, that is the finding.
A compensation team can usually answer the first two in a week from the HR system where pay and ratings are already stored. The third depends on whether the reason codes were filled in. The paper shows how to run each one, adds a fourth question about where the rest of the variation in pay lives, and gives Syndio’s numbers for the first two to compare against.
Does this apply outside the U.S.?
Our analysis covers U.S. employees only, so it does not show what pay and ratings look like in the EU or elsewhere. But the same question applies. The EU Pay Transparency Directive requires employers to disclose pay ranges and, starting June 2027 for employers with 150 or more workers, to report on gaps. With ranges posted, employees can see the number, so the reason behind it matters more.
Read the paper and join the conversation
Read the paper. The Last Mile of Strategy shows how to run the three questions on your own data and what to change first. Get the paper.

About the data
Syndio analysis of aggregated, anonymized customer data, extracted October 2026, one record per employee. U.S. employees at Syndio customers, which are not a random sample of employers. Base pay: 158,403 employees at 46 organizations. Total cash: 163,343 employees at 53 organizations. Ratings were normalized from each organization’s own scale to a common one. The data is one moment in time. Merit budget range: WorldatWork, Salary Budget Survey 2024-2025. Study cited: Heneman (1973).
The information provided herein does not, and is not intended to, constitute legal advice. All information, content, and materials are provided for general informational purposes only. The links to third-party or government websites are offered for the convenience of the reader; Syndio is not responsible for the contents on linked pages.