Analyzing your workforce for opportunity equity can be a daunting task. The fact is that inequity issues arise from a web of interrelated employment processes, including hiring, promotion, performance evaluation, attrition, and more. While organizations with more mature workplace equity analytics programs regularly investigate each of these employment processes, an organization that is just starting out can learn some lessons from even a relatively simple analysis.
In this post, we will explore the data you definitely need to get started with an opportunity equity analysis, and other variables you may want but which are not necessary to begin identifying and addressing barriers that exist in your organization for specific communities.
Data you do need for an opportunity equity analysis
When it comes to an opportunity equity analysis, there are certain baseline variables you need to get started.
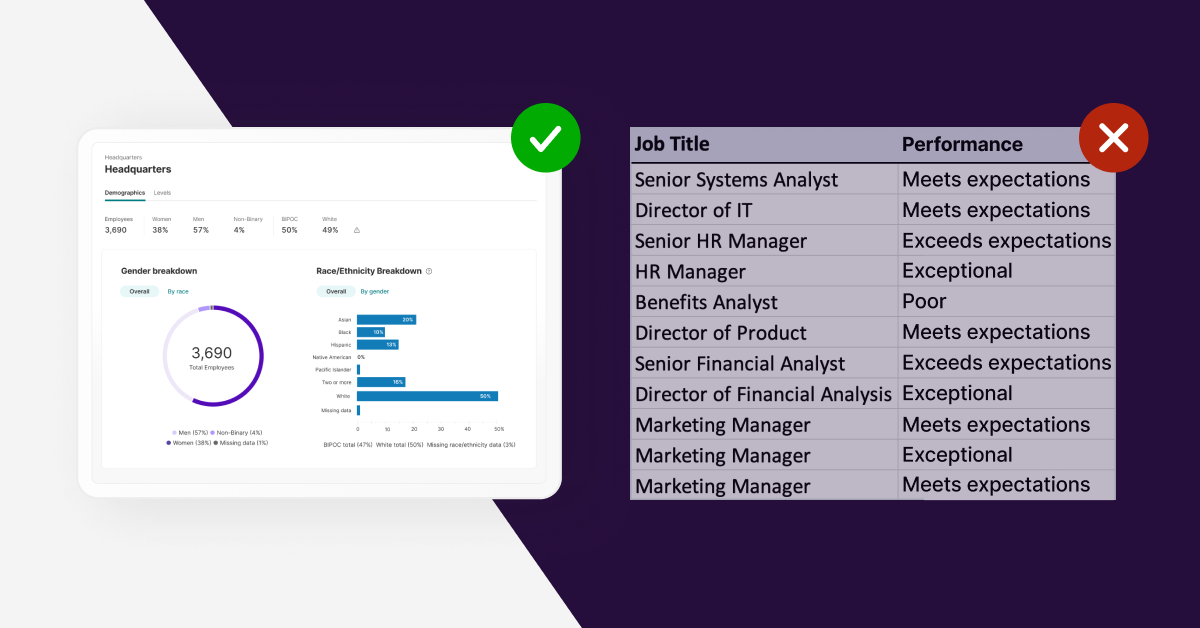
1. Sufficient coverage of protected class variables. As in a pay equity analysis, the first critical thing you need is sufficient coverage for the variables of interest, such as gender and race/ethnicity. That means you should have enough coverage of these variables to identify meaningful patterns in representation or employment outcomes.
Unlike a pay equity analysis where you need a certain number of employees from each community to leverage statistical tools like multiple regression, the lack of women or ethnic minorities in leadership or among promoted employees can provide the actionable insight you need to inform your workplace equity program. While you may not have a complete dataset, so long as you have data for most of your employees, you can start identifying these key trends.
In the U.S., organizations usually have great data on gender and race/ethnicity due to government reporting requirements, and the UK is catching up on collecting ethnicity data. In the rest of Europe, coverage for gender tends to be good while data on race, ethnicity, and national origin are less commonly collected or analyzed.
2. Employee identifiers. Additionally, you need an employee identifier so that everyone can be uniquely identified throughout the process. Organizations with a modern HRIS(s) typically already have this, as databases require some form of unique identifier. The ability to take any actions back to your business and clearly identify who you’re talking about is critical — so if you don’t have an employee ID available, you likely have some other bridges to cross before you begin your analysis.
3. An organizational framework. For an opportunity analysis to be effective, it needs to reflect the organization in a way that resonates with leadership and employees. One of the challenges with government-mandated reporting is that it is often too high-level (e.g. EEO-1 reports, which collapse jobs into ten overly broad categories) or too low-level (e.g. Affirmative Action Plans for federal contractors, which are typically established at the intersection of job groups and locations).
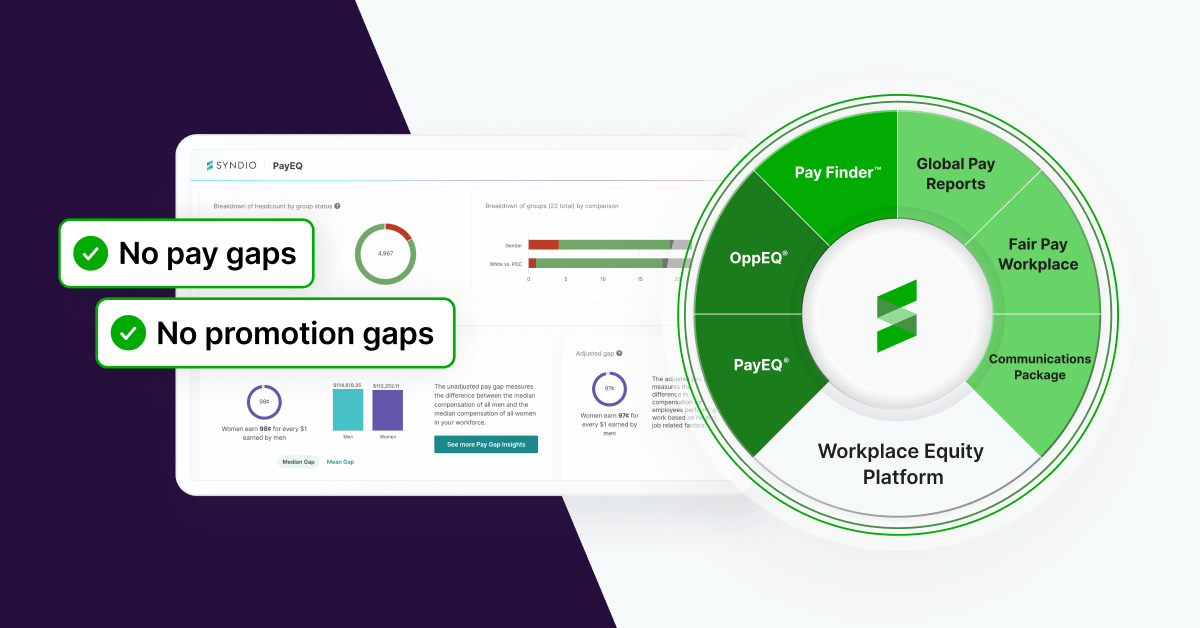
There are two keys to an effective analysis: the first is to combine the organization broadly enough to make big picture trends clear, allowing leadership to ‘see the forest for the trees’. The second key is to drill into specific sub-organizations that can highlight whether the observed issue is driven by a few regions or departments, or if it is generalized across the entire organization. Our opportunity equity analysis software OppEQ® allows organizations to easily identify both high-level trends and lower-level hotspots for opportunity inequities. You may already have an organizational framework in place that allows you to zoom in and out in the way you would want for this analysis.
However, many organizations we work with on their initial opportunity equity analyses find that their current organizational frameworks are better suited to this analysis after some tweaking. You may have the right framework in place already, but as long as you have an organization chart that can serve as a starting point, you will be able to tweak it to get to something that resonates with both your leadership and your employee base.
4. A leveling structure or job architecture. Similarly, organizations have a head start if they have a well-defined job architecture that reflects which roles have higher levels of responsibility or authority in the organization. That said, there are often tweaks to be made and a balance to be struck when applying a job leveling framework to an opportunity equity analysis. Often, the leveling framework differs between divisions. For example, many of our manufacturing, retail, and food service clients draw a bright line between their front-line operations, their supply chains, and their support functions. This is because career ladders are often very different in these different arms of the business.
For an opportunity equity analysis, it is helpful to rethink the leveling structure and organizational framework in tandem. Another thing we commonly see is that when organizations use pay grades as a starting point, they will combine some grades while splitting others to capture differences in leveling. For example, specialized technical individual contributors (ICs) may be in the same pay grade as directors of less technical functions — but the organization may want to combine director-level positions across multiple grades while removing ICs from the job group. Making changes here can ensure that the analysis captures the reality of the organization while allowing for the aggregation and disaggregation that helps identify trends and hotspots. If you think your job architecture needs a refresh, do not let that be a blocker to this work. Once again, as long as you have something that can serve as a starting point, you can adjust to get something that is purpose built for a meaningful opportunity equity analysis. In fact, this process may spark some conversations that help clarify some job architecture questions.
Data that are nice to have
Other data fields can get you to the right analysis faster, or enable you to go one step deeper and examine specific employment processes. While having access to these data fields can give your analysis a leg up, many organizations either adapt existing data structures or develop new ones — so while these fields are nice to have, missing them should not keep you from starting.
1. Differentiated job titles or something similar. For most organizations, there is a clear delineation between roles, and job titles act as a way to identify individuals with differing roles and responsibilities. Job titles also serve as the base unit for mapping employees to labor market availability pools, which provide an important benchmark for the demographics of potential job candidates. If your organization has no job titles, overly generic job titles, or is inconsistent with titling, we will spend more time reviewing these jobs in context of where they sit in the organization.
2. Recruiting data. One key part of benchmarking to the labor market is determining which roles tend to be filled internally, which tend to be filled externally, and what the internal/external split tends to be. For example, many organizations find that entry level roles are filled almost exclusively with external hires with a negligible number of transfers or demotions, while shift supervisor positions are filled primarily with internal candidates, and managerial positions take a 50/50 split. Historical data are helpful in providing a baseline here, but it is possible to make reasonable assumptions based on the organizational unit and job level.
3. Reliable historical personnel data. The ability to go “back in time” with your HR data can help identify key trends in representation. This historical view provides context for the current state of which communities are or are not represented. The actions your organization decides to take may be different if you have never had success in attracting, promoting, and retaining historically underrepresented groups vs. if you are trending towards increased representation, or if you are starting to see declining representation due to attrition issues.
Even when organizations have the data they need to take a look back, the first step in the process is creating a clear reflection of your current state. As discussed above, this includes determining the right organizational and job leveling frameworks.
One major benefit of historical data is the ability to create promotion or attrition flags, and identify trends in recruiting or hiring. This moves you from a static view of the current state to an analysis of the underlying dynamics that are driving the observed gaps. Is there a lack of female managers because you are only promoting men? Do you tend to hire externally for management, and are those external hires more likely to be men? Do you fail to retain women once they reach the level of manager? These key dynamics provide important guidance for how you may want to intervene to achieve your organization’s long-term workplace equity goals.
“Wish we had” data that you often may not need
1. Goals to track or hypotheses to test. Frequently, organizations have an idea or stated aspirational goals of what they would like to look like. These goals frequently include increasing the representation of women and people of color in management and leadership positions, or in other key roles. Additionally, many of our customers come to us with specific hypotheses about departments that they suspect may be hot spots for inequity. You do not need to have these specific questions to begin your opportunity equity analysis – we can help perform statistics at scale in a way that likely answers the questions you have, and many that you did not think to ask.
2. Promotion flags. Many organizations do not have consistent coding of promotions. If this sounds familiar, rest assured that you are not alone. Ensuring equitable access to promotions is a key component of workplace equity, but every analysis of promotions requires a review of these promotion flags, even when they exist. Frequently, organizations like to think about promotions differently — e.g. excluding in-line promotions attached to title bumps (e.g. analyst to senior analyst) for one view and including them for another.
3. Promotion control data. There may be important factors that explain why some individuals are promoted and others are not, such as time in role or their history of performance ratings. Layering in these controls can help identify why differences in promotion rates occur, but we often find that one of the biggest predictors of promotion rates is the organizational structure or job hierarchy. You can go quite far by testing for protected class-based differences in promotion rates at different levels and within specific departments, so the lack of control data does not block you from getting actionable insights.
4. Clean applicant tracking system (ATS) data. Getting a deeper analysis of the hiring funnel can be extremely helpful. Is it that certain communities aren’t applying, are not being interviewed, or are not receiving or accepting job offers at your organization? That said, many organizations keep their applicant tracking data in a separate location from their core HRIS, and those data can be messy and difficult to structure and analyze. It is possible to conduct a high level overview of hiring dynamics without it (e.g. comparing the demographics of your hiring pool to a relevant labor market benchmark), and that initial analysis can help determine whether those deeper insights are worth the effort of obtaining and structuring your ATS data.
What you will get out of your first opportunity equity analysis
Your first opportunity equity analysis will answer the following questions:
- What do we look like today? The process of generating the right organizational and hierarchical frameworks for your organization will allow you to create an accurate reflection of your organization. This reflection will highlight whether and where you have potential issues in your organization, and will serve as the baseline for tracking improvement over time.
- What should or could we look like? Though there is not a single authoritative source of truth for what your organization should look like from a demographic perspective, an effective opportunity equity analysis will identify whether specific communities are baseline underrepresented in your organization, and whether that representation fails to reach certain levels of management or leadership. You should have the answer to these two questions: a) where and how do we fall short of labor market demographics for historically underrepresented groups? And b) when and how does our management and leadership structure fail to represent the demographics of our rank and file workers?
- What are the right key performance indicators for our workplace equity program? One of the challenges of an opportunity equity analysis is a curse of dimensionality: when you consider the number of employment outcomes you may want to track (representation, hiring, promotion, retention, performance ratings, and more), combined with the possible levels of aggregation (org-wide or by department) and the various communities of interest, you end up with thousands of potential KPIs. Your initial opportunity equity analysis should clarify for your organization which issues are most acute in different parts of your organization. You can also use the analysis to provide an analytical foundation for forecasting, calibrating, and scenario testing your long-term representation goals.
- Where do we need to dig deeper? Further exploration can take a couple of different flavors. You may want to conduct a more thorough hiring funnel analysis if you see extremely imbalanced hiring patterns in certain functions. You may want to take a more qualitative approach in areas where there are retention issues for particular communities, conducting exit and stay interviews to identify key issues.
The only way to begin is by beginning
Getting started with your first opportunity equity analysis can seem daunting, and it is easy to imagine all the analyses that you would like to conduct but that your organization’s current data collection could not support. However, do not let those cases keep you from gleaning the insights you can get from the data you currently have on hand. As your analysis matures, you can identify the additional analyses your organization needs. Let experience be your guide along the way, rather than missing the opportunity to learn something because you may not have what you need to learn everything.
An expert partner can help you conduct a meaningful analysis, even with limited data available. At Syndio, we can help you figure out the best approach for your organization, so you can start taking steps towards lasting change.
The information provided herein does not, and is not intended to, constitute legal advice. All information, content, and materials are provided for general informational purposes only. The links to third-party or government websites are offered for the convenience of the reader; Syndio is not responsible for the contents on linked pages.


