2022 Workplace Equity Communications Lookbook
We've identified several trends in how leading companies are being transparent about their workplace equity efforts, data, and outcomes. Explore the lookbook below.
Being transparent about workplace equity is a competitive advantage.
To get workplace equity right, companies must ensure they're hiring, compensating, supporting, and advancing employees based on what they have to offer — not their gender, race, or other factors. In an era where investors, boards, employees, job seekers, consumers, regulators, and legislators are increasingly demanding proof of progress around equitable pay, equal access to opportunities, and diverse representation, effective communications can make or break your brand.
Companies should seek to own their workplace equity narrative by proactively sharing progress — even when that requires being honest about challenges — rather than waiting to be asked by stakeholders, or worse, having their workplace equity story told for them through employee complaints, poor online employer reviews, or low scores on third-party ratings. Leading brands are delivering on the call for transparency by providing accessible and visually compelling workplace equity communications that transform equity topics from a potential liability into a brand advantage.
But what does effective workplace equity communication look like? What suits your brand and your journey?
To inspire your own workplace equity communications, we curated a range of publicly available examples from 20+ companies — from blog posts, videos, infographics, and press releases to in-depth DE&I and ESG reports and web pages. How reporting looks varies across organizations, but these leading brands are setting themselves apart by sharing their goals, metrics, and progress with clear, creative visuals and messaging.
As these examples show, workplace equity communication is so much more than a dry compliance exercise. When done well, it embodies your brand, creating another connection point with the audiences that matter most to you.
Disclaimer: This lookbook was built using publicly available workplace equity communications. Inclusion in the lookbook does not imply any relationship between Syndio and these companies.
Ready to put your workplace equity communication plans into action?
The examples showcased above demonstrate how proactive transparency around workplace equity can become a brand advantage in a world where this information influences brand reputation, investment analyses, career decisions, and consumer purchasing choices. Being transparent about your workplace equity goals, efforts, and achievements allows you to shape the overall narrative of progress at your company — what you're doing to get from where you are today to where you want to be.
And, as you can see, there's no one "right" way to communicate about workplace equity. As long as you're aligning your communications strategy with your company objectives and people goals, you'll be doing it right.
Now it's your turn to put transparency into action. Check out our Workplace Equity Communications Playbook for guidance on the nuts and bolts of how to develop your own communications strategy, step by step.
Have you seen great examples of companies communicating about workplace equity? What strategies have worked for your company? Share your examples using #TalkAboutWorkplaceEquity
Ready to get started?
2022 Workplace Equity Communications Lookbook
01Showing progress over time
One of the top ways that companies are communicating about workplace equity is by illustrating progress over time, year over year, through charts, graphs, and data-backed narratives. Workplace equity is a journey of progress, not instant perfection. Most companies have to create an action plan to get to where they want to be from where they currently are. However, by communicating honestly along the way and being open about goals that have been achieved — and areas where there is still room for improvement — you can demonstrate your company's commitment to actionable, ongoing progress and transparency.
 While we continue to make strides that create meaningful change for our people, we know we still have a lot to do. We are committed to ongoing actions to increase diverse representation at senior levels to help us to close our pay gaps."
Jackie Henry
UK Managing Partner People & Purpose
Deloitte UK

Employee size: 20,000+ (in UK)
Industry: Professional Services
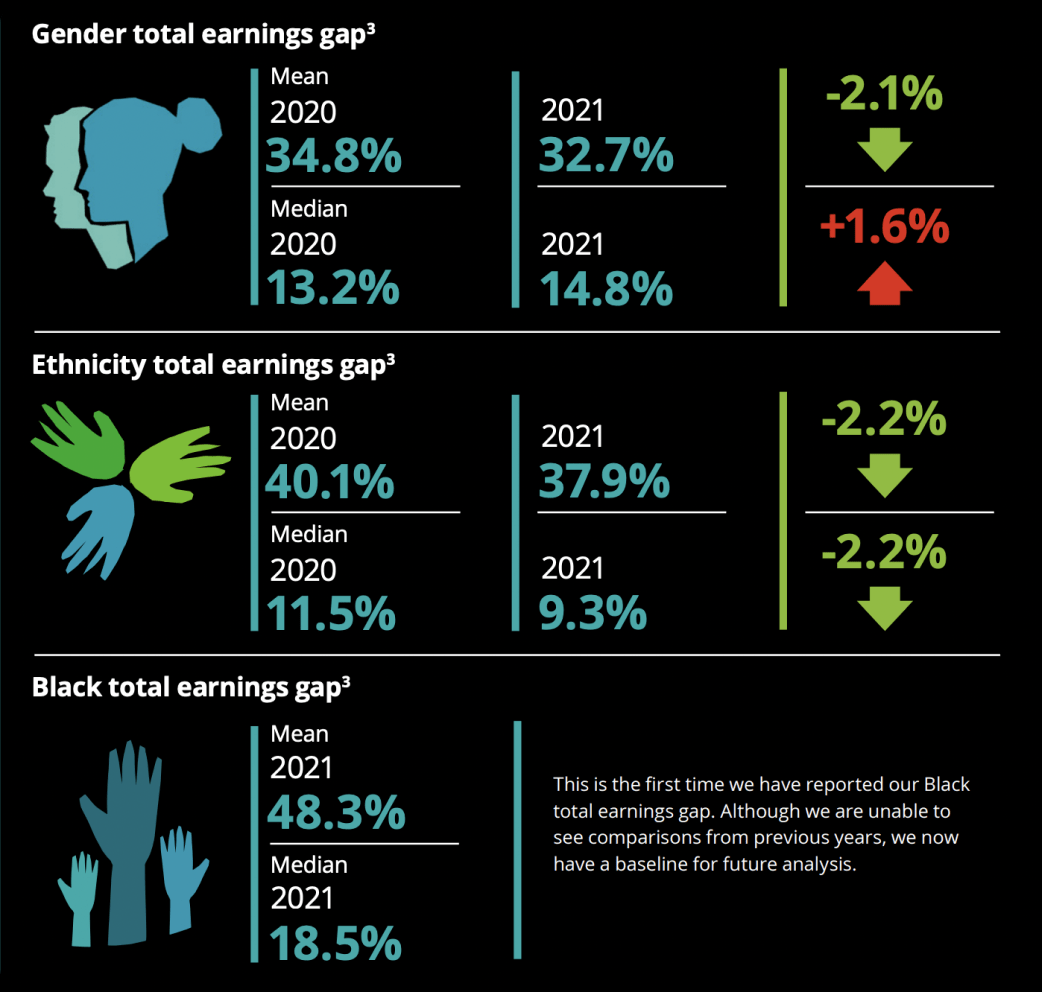
What stands out: Clear comparison visuals and a written narrative explaining the changes in gender, ethnicity, and Black pay gaps from 2020 to 2021
Deloitte UK's Pay Report 2021 has a useful "at-a-glance" infographic that shows changes from 2020 to 2021 for their mean and median pay gaps that go beyond the required UK gender pay gap reporting to include pay gap data across ethnicity and Black employees. Their snapshot page clearly illustrates year-over-year percentage increases or decreases with green up arrows and red down arrows. Deloitte UK's blog article "Reducing our pay gaps, increasing our transparency" provides a written narrative around their headline pay gap figures compared to the previous year's figures. They also share promotion percentage increases from the previous year for these underrepresented groups.
Other highlights: Deloitte UK also voluntarily discloses their CEO-to-employee pay ratio, despite not being covered by pay ratio regulations. Their report provides thorough coverage of their median and mean pay gap, bonus gap, and earnings gap for gender, ethnicity, and Black employees, as well as quartile earnings for each group. They also clearly address the under-representation driving their pay gaps and provide action plans to create more equal opportunities in hiring, rewards, and career development for each category.
At a glance - Deloitte UK
Data as at 5 April 2021 - a whole firm view including both our employees and their partners
Addressing the gap
In recognition that both their gender and ethnicity pay gaps are driven by us having lower female and ethnic minority representation at senior grades, they are working hard to address this imbalance by supporting the development and progression of women and ethnic minority colleagues, continuing to deliver against their Black Action Plan, and working with their diversity networks to champion allyship and advocacy.
Jackie Henry, UK Managing Partner People & Purpose at Deloitte, said:
 This year, 30% of those promoted to partner were women, an increase of 3% on 2020. We've also seen the number of ethnic minority partner promotions increase from 13% in 2020 to 14% in 2021."
 While we continue to make strides that create meaningful change for our people, we know we still have a lot to do. We are committed to ongoing actions to increase diverse representation at senior levels to help us to close our pay gaps."
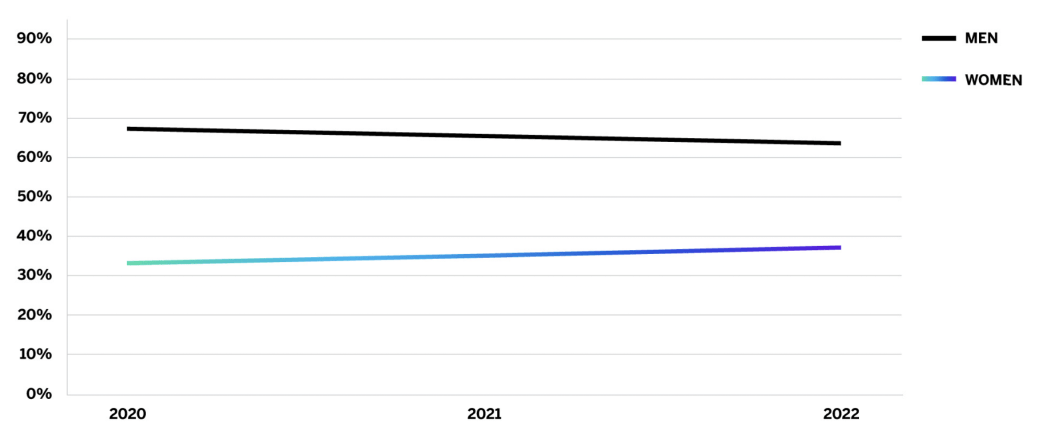
Headline gender pay figures for Deloitte UK
These tables show our overall median and mean gender pay and bonus gap based on hourly rates of pay as at the snapshot date of 5 April 2021, and bonuses paid in the year to 5 April 2021.4

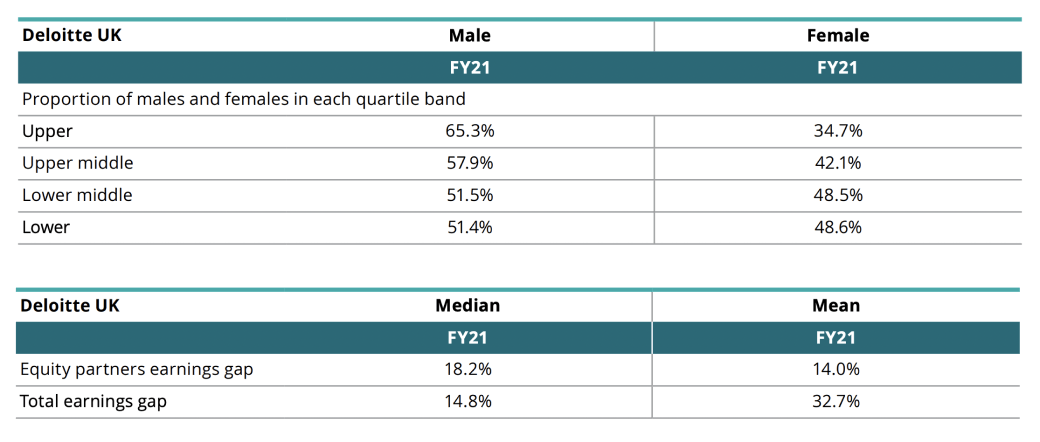

What stands out: Mix of line graphs and call-out percentages illustrating 1- and 3-year growth rates.
Qualtrics' Diversity, Equity, and Inclusion 2021 Report uses line graphs to demonstrate 3-year growth rates for global, leadership, technical role, and sales role representation across both gender and ethnicity. They also use bold percentage illustrations to call out overall representation figures for those groups, as well as growth rates.
Other highlights: Qualtrics' report shares that they use an independent third party to review their gender pay equity — and that in their most recent review, they achieved a global gender pay equity ratio between men and women of 1:1. They also share the outcome of their promotion rate analysis.

Diversity, Equity, and Inclusion 2021 Report
URM leadership (L5+) at Qualtrics
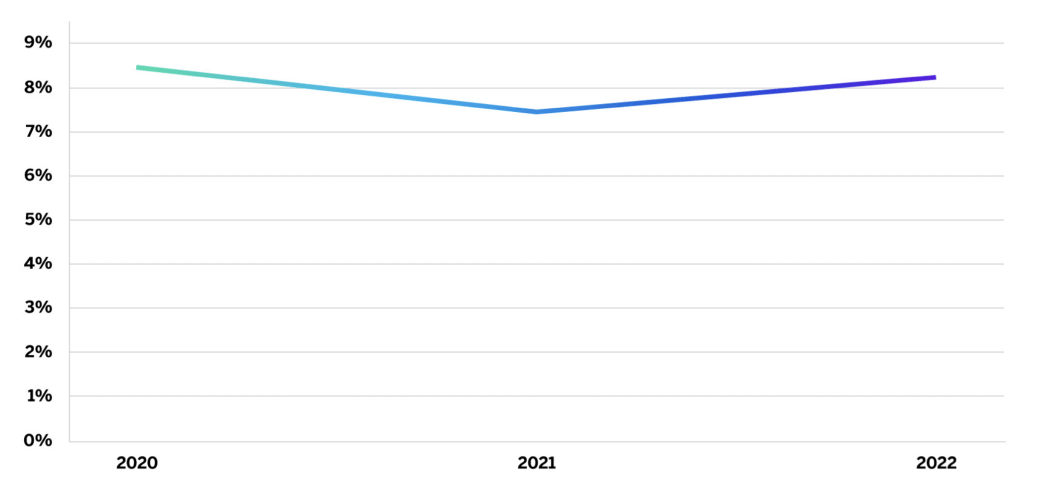


Our global representation of women
Although we are reducing the gap, we have more to do to create more gender representation parity in our organization.
N.B. Representation of women is calculated as women as a percentage of our total workforce population.


Equity
We use an independent third party to review our gender pay equity. In our most recent review, we have global gender pay equity and our global pay equity ratio between men and women is 1:1.
How do we define pay equity?
Compares what women are paid versus their similarly situated male coworkers, "controlling for" or "statistically adjusting" for factors such as job, seniority, and geography. Often referred to as "equal pay for equal work."
Promotion rates
We continuously assessed our annual promotion rates for women and URMs and found no statistical difference in the promotion rates across the groups.
Learning and development
We will invest in learning, Growth and Development, Internal mobility, Coaching, Sponsorship with a lens on diversity-measuring the learning and development gap.

 Equal pay is a global imperative. We must tighten the gap to the point where it's no longer a topic of conversation."
Gina Shielbey
Chief Communications Officer
Qualitics

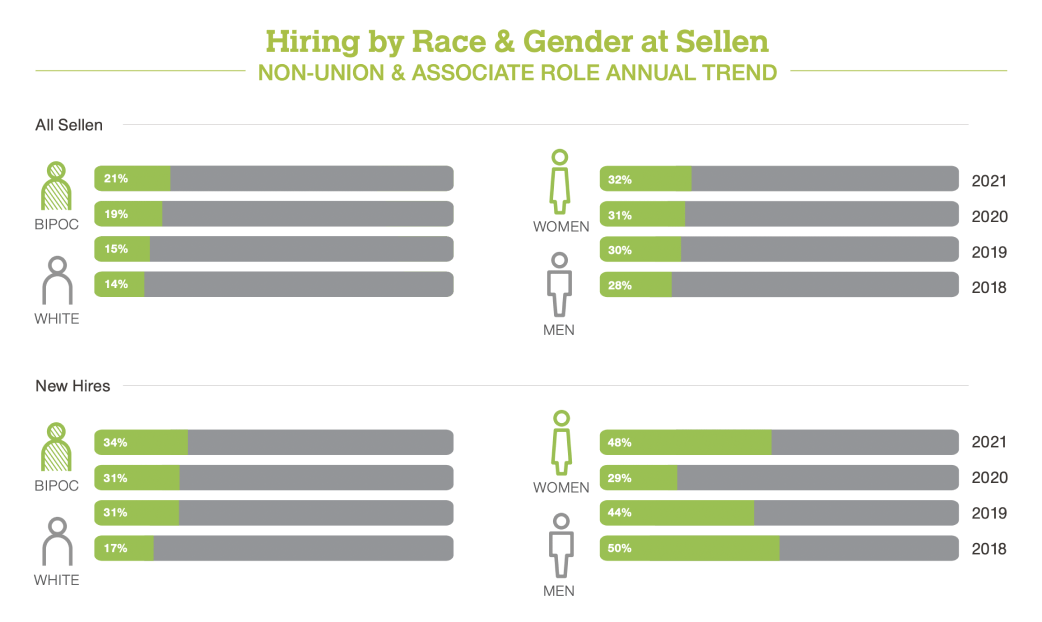
What stands out: Bar graphs show leadership representation and hiring trends for the past four years for BIPOC and women employees
Sellen Construction is one of the smallest companies in this lookbook — proving you don't have to be a huge enterprise to systematically address inequities at your company and deliver top-quality workplace equity communications. In their 2021 Diversity, Equity & Inclusion Year in Review report, Sellen uses bar chart comparisons to provide a snapshot of representation trends for both leadership and hiring by gender and race, over the past four years.
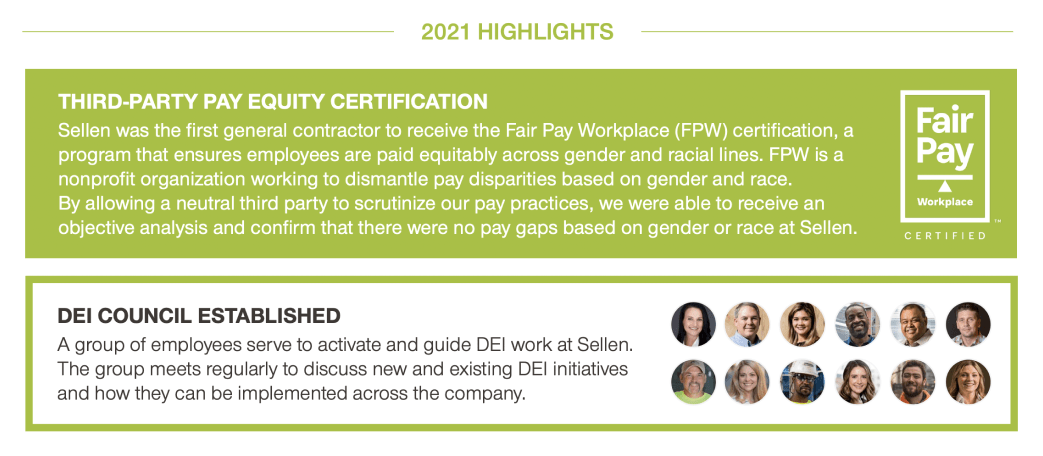
Other highlights: Sellen shares that they've achieved pay parity for gender and race (i.e. equal pay for similar work), and that they've obtained third-party certification from Fair Pay Workplace, further setting themselves apart as leaders in workplace equity.They also use pie charts to show quartile earnings by race and gender and explain the drivers of their opportunity gap, as well as actions they are taking to close that gap.

2021 Diversity, Equity & Inclusion Year in Review
Leadership representation at Sellen
Annual Trend

Opportunity gap at Sellen
Sellen is a Fair Pay certified employer, and we are proud of the pay equity we have achieved within our company. We have achieved pay parity for gender and race within similar positions, and we recognize that significant work remains in the years to come.
The "opportunity gap" refers to the need to increase the representation of women and BIPOC employees in higher paying roles. When we achieve greater diversity in our higher paying jobs, we begin to close the opportunity gap. At Sellen, closing this opportunity gap will be done through recruiting efforts and leadership development.

02Being creative — but clear — with data visualizations
Top brands are getting creative with how they illustrate their workplace equity data to make information easy to understand and consume. Simple, clear graphics can tell a more compelling, understandable-at-a-glance story than blocks of text. Try mixing up chart and graph styles, or highlight key data points with an infographic. Some companies on this list have even created interactive formats that let users explore and dig into data in a more engaging way. However, it's critical to balance creative data visualization with clarity — graphics should always serve the data and provide an accurate picture of where your company stands.
 We understand the power of data and analytical rigor... we are committed to sharing [representation and pay data] publicly to illuminate where we've made progress, where we've fallen short and why and where we need to focus our efforts moving forward."
StitchFix

Employee size: 43,000+
Industry: Tech
What stands out: Beautiful and varied charts illustrating in-depth workplace equity metrics
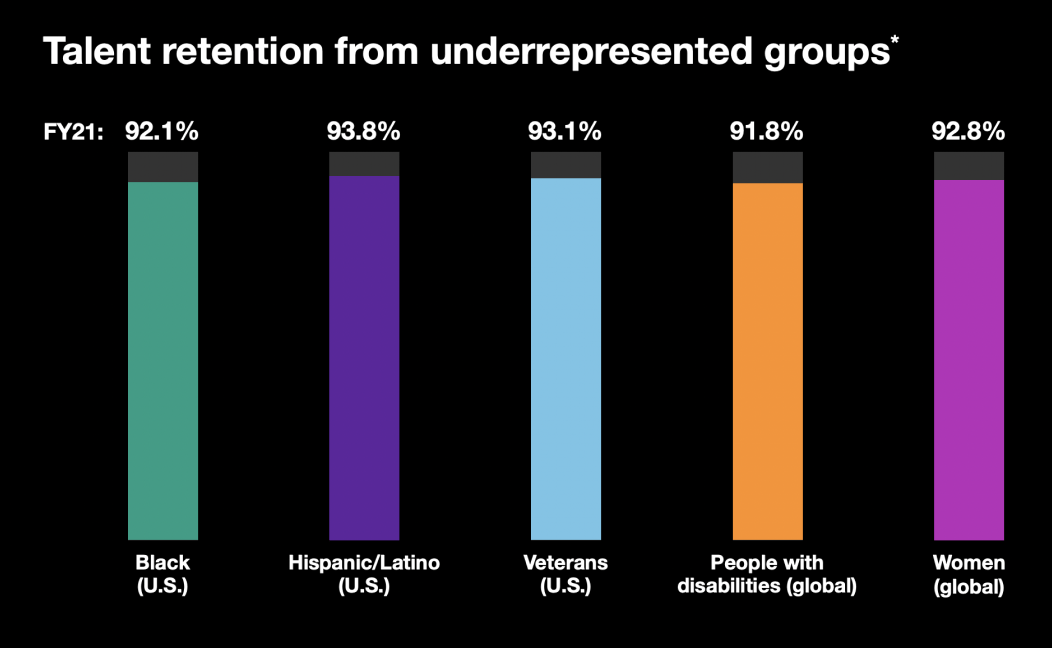
In their DEI Annual Report 2021, Micron showcases a range of chart types to deliver workplace equity information. These charts break down data across a range of employee demographics, including gender, ethnicity, veteran status, and disabilities. Micron's report clearly maps goals such as 'increasing representation of underrepresented groups' to actionable drivers such as talent retention and inclusive hiring, sharing data for both outcomes. A "key wins" call-out section shares at-a-glance data highlights. Several in-depth bar charts and pie charts compare three years of results for various representation data.
Other highlights: Micron shares that they achieved global pay equity for all underrepresented groups and closed pay gaps in all aspects of compensation, including base pay, cash bonuses, and stock rewards. Micron has been disclosing key data in their DE&I report for four years, but raised the bar on transparency this year by also publicly disclosing their EEO-1 Component 1 diversity data and Component 2 pay data. To improve accountability, they name specific executives as owners of each DE&I commitment and share that they tied team member and executive incentive plan goals to their DE&I targets. An additional — and outstanding — piece of workplace equity communications content is their Pay Equity at Micron video that provides an easy-to-understand explanation of Micron's pay equity process.
Increased representation of women
In addition to the progress we made increasing board diversity, we increased representation of women in all job groups. Our aim is to see even more women thrive at Micron and in our industry, and we're working to make that happen with extensive outreach, inclusive hiring, global pay equity, advancement programs and more



Employee size: 6,000+ (in UK)
Industry: Energy
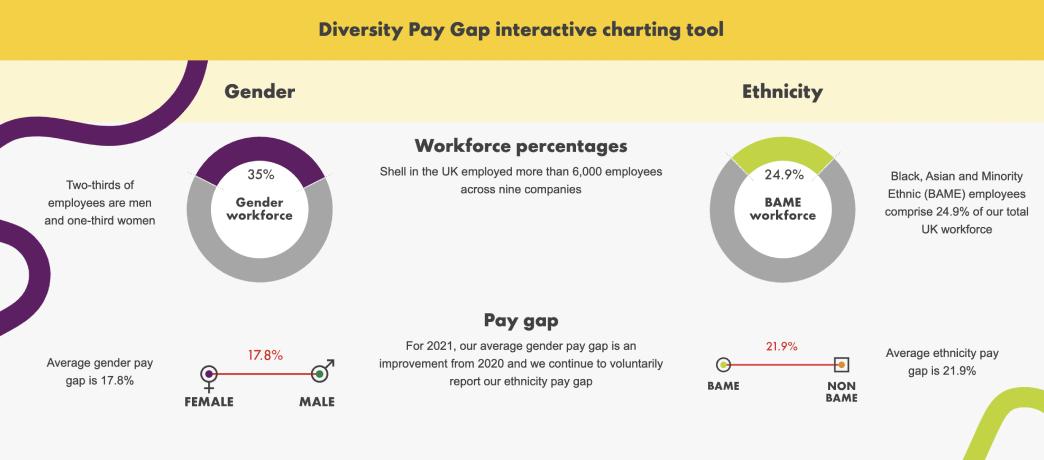
What stands out: Interactive charting tool provides an engaging format to explore gender and ethnicity data for representation percentages, pay gaps, and bonus gaps
While gender pay gap reporting is required in the UK, Shell in the UK shows that compliance can be so much more than just a dry pdf filled with tables by breaking their findings out into other digestible content formats. They voluntarily disclose ethnicity pay gap data as well. Their interactive Diversity Pay Gap charting tool allows users to toggle between mean and median pay gap and bonus gap data for gender and ethnicity, with the ability to explore annual data for the previous four years.
Other highlights: In addition to the interactive charting tool and link to their full 2021 Diversity Pay Gap Report, Shell in the UK's Diversity Pay Gap webpage shares case studies that provide narratives around specific actions being taken to improve representation and inclusivity. It also links to two videos that explain how Shell is closing the gender gap and how Shell is closing the ethnicity gap.


Employee size: 26,000+
Industry: Tech
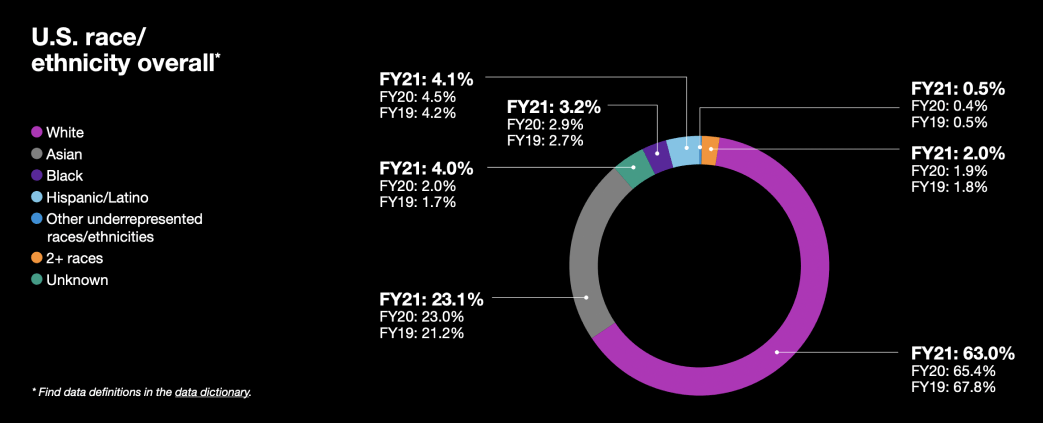
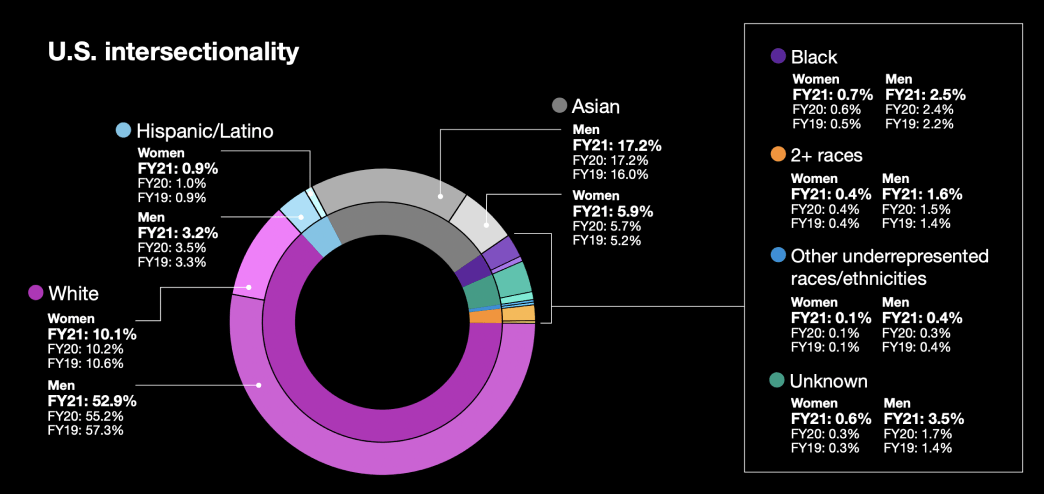
What stands out: Variety of chart types "slicing and dicing" a wide range of workplace equity data across both gender and ethnicity, and demonstrating both pay and opportunity equity
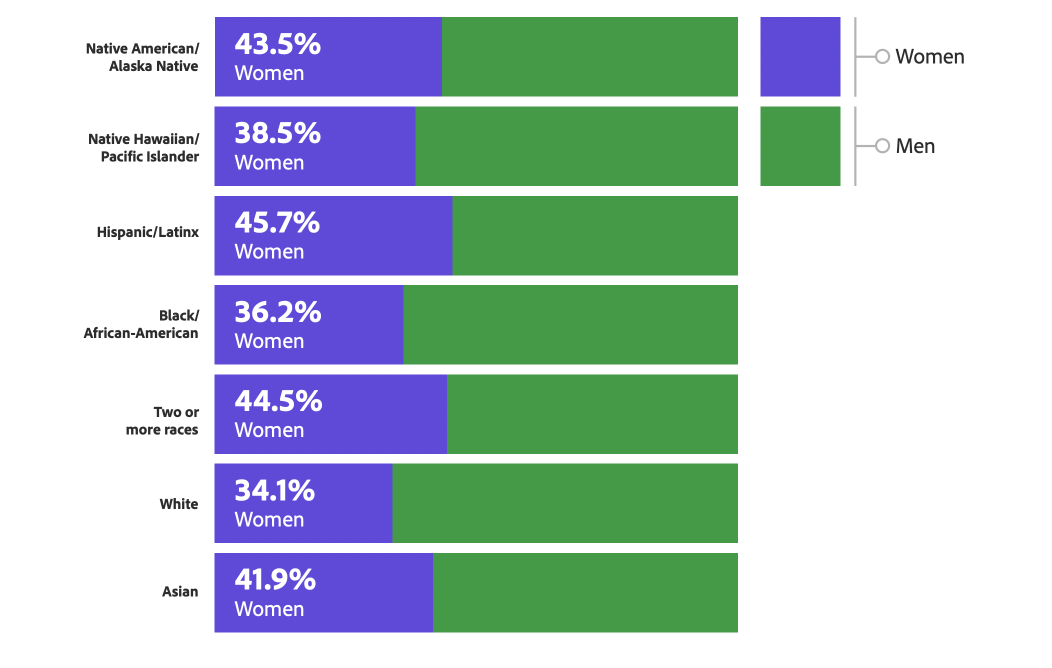
With a webpage dedicated specifically to parity data, Adobe clearly presents their achievements for both gender (global) and ethnicity (U.S.) pay parity and opportunity parity, providing a holistic view of workplace equity at the company. Their Diversity & Inclusion Year in Review 2021 report uses a variety of chart types to illustrate everything from 5-year representation growth data to deep dives into year-over-year representation across individual contributors, people managers, leadership, and technical roles. They also break down intersectional representation with two different views (race/ethnicity by gender, and gender by race/ethnicity).
Other highlights: Adobe's DE&I report shares specifics on how Adobe is driving diverse representation through building a diverse talent pipeline, fair hiring processes, and inclusive talent development. An added communications bonus, Adobe's diversity webpage has a compelling video showcasing employee voices and stories.
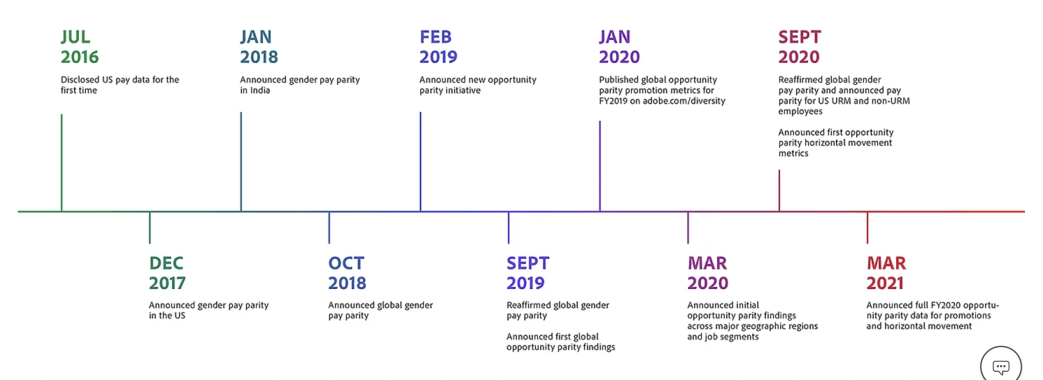
Our Journey to pay and opportunity equity
Our progress
Pay parity
We have achieved global gender pay parity and parity among U.S. underrepresented minority (URM*) employees and non-URM employees. We continue to monitor our progress to ensure that we are creating a culture that fairly rewards and recognizes the contributions of all employees.

Opportunity parity
In February 2019, we coined the term "opportunity parity" to mean fairness in promotions and horizontal movement across demographic groups. Our FY2020 global gender and U.S. URM*/non-URM promotion rates are reflected below. Learn more and review additional opportunity parity data.

US race/ethnicity by gender FY2021
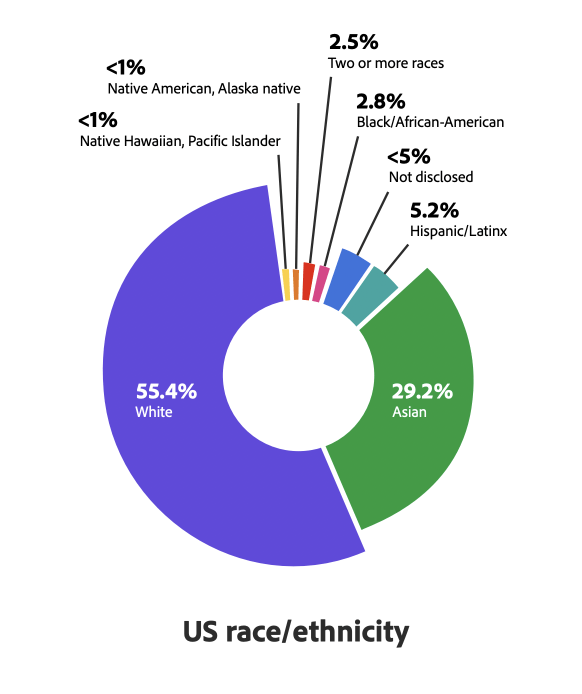
US race and ethnicity at Adobe
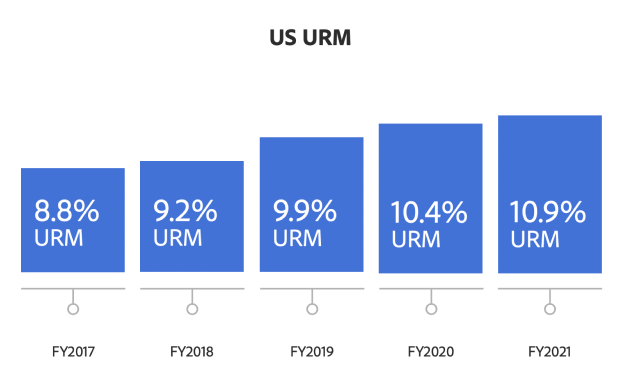
At the end of FY2021, URM employees comprised 10.9% of our US employee base. From the end of FY2017 to the end of FY2021, the total population of US employees self-identifying as URM increased from 746 to 1,461-a 95.8% increase.
03Going deep into multiple facets of workplace equity
Leading companies are going much deeper in their analytics and disclosure than the bare minimum of reporting on gender and/or ethnic diversity. While any steps towards transparency are positive, the deeper you go, the more valuable your communications will be to employees, job seekers, and investors. To cover the full range of workplace equity metrics, organizations should share pay equity data and opportunity equity data — which includes breakdowns on hiring, promotions, and leadership diversity.
All workplace equity metrics should cover gender and race in the U.S. and gender globally at a minimum, with a strategy to consider and expand your reporting to include other demographics such as age, veteran status, LGBTQ+ identity, care-giver status, and disabilities, depending on the makeup of your employee population. Lastly, many top companies include a description of their pay equity policies, analysis practices, and remediation processes.
 Only through comprehensive, quantitative reporting will corporations be accountable to investors and employees alike and create a benchmark through which to fully manage pay equity."
Michael Passoff
CEO
Proxy Impact

Employee size: 6,000+
Industry: Utilities
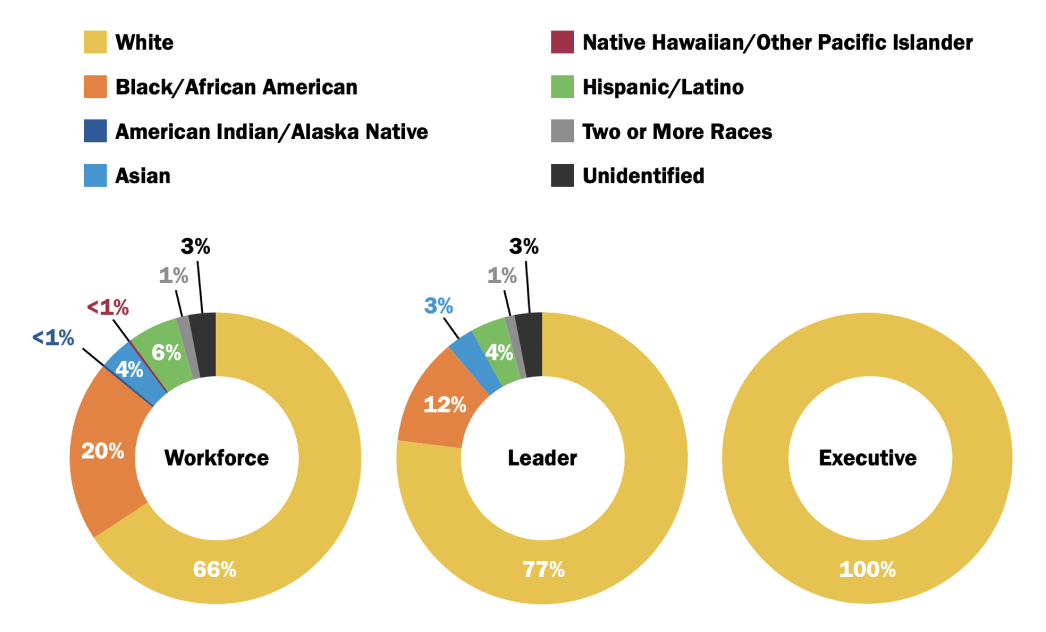
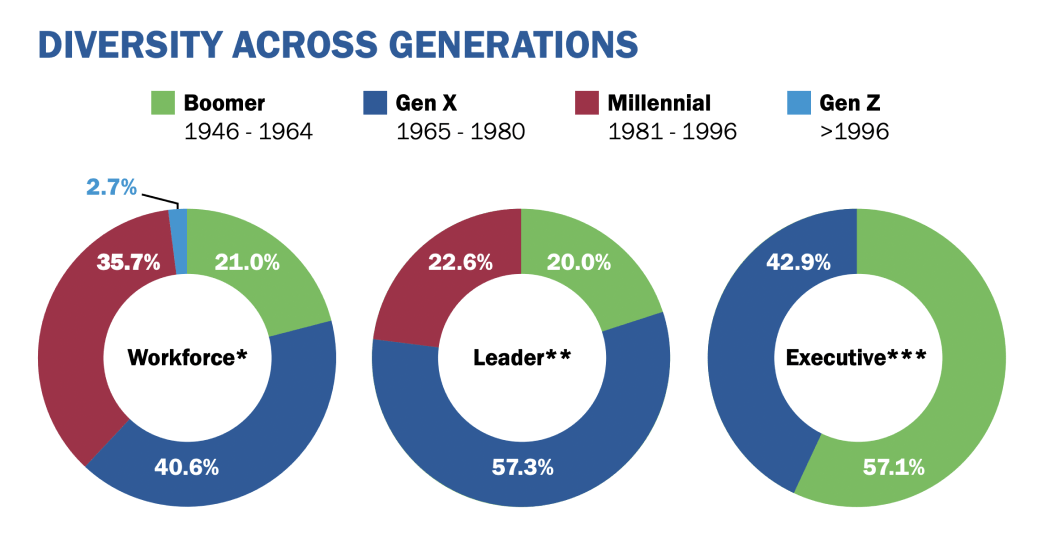
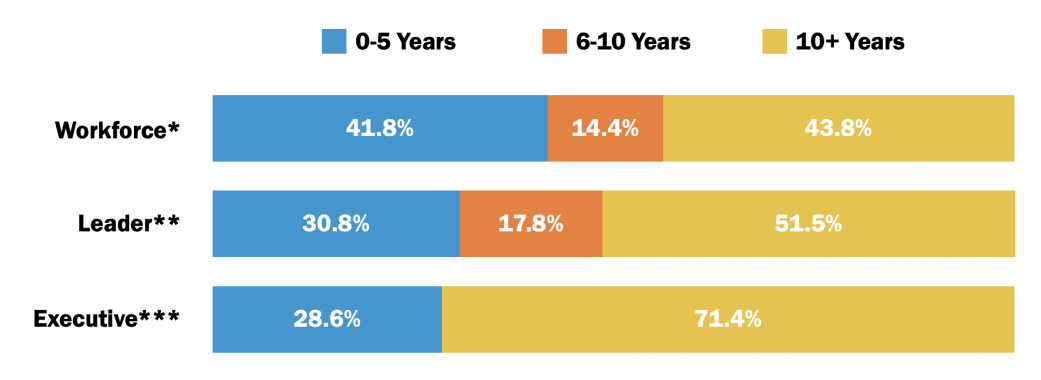
What stands out: Clear, varied data visualizations for more than just gender and ethnicity, including disability, military/veteran status, military spouse status, LGBTQ+ identity, generation, and tenure.
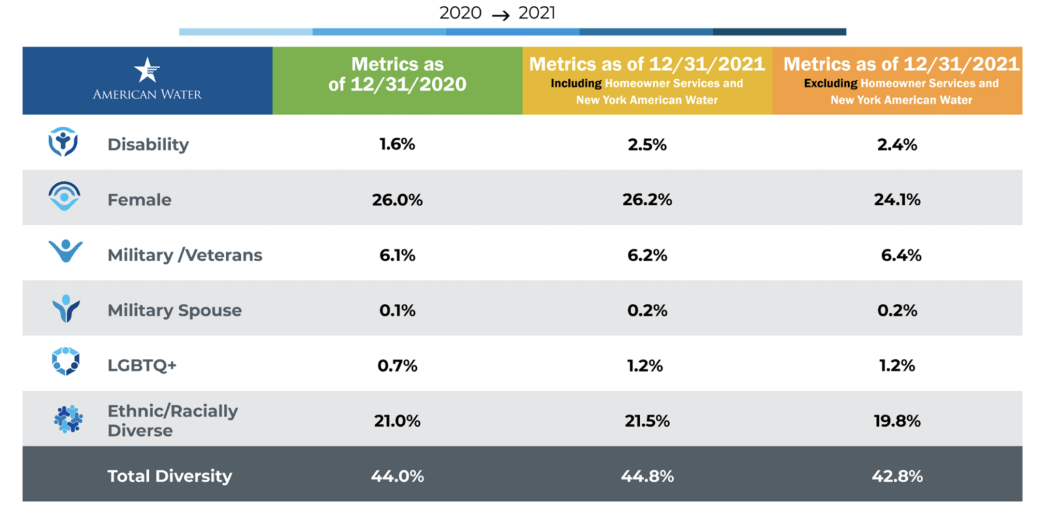
American Water's 2021 Inclusion, Diversity & Equity Report provides diversity data for a comprehensive range of employee demographics, going much deeper than most other companies' communications. In addition to gender and ethnicity, they also report on data for disability, military/veteran status, military spouse status, LGBTQ+ identity, generation, and tenure. Their report also covers opportunity equity-related data such as leadership and executive representation, transfer/promotions, new hires/rehires, and requisitions with diverse candidate pools.
Other highlights: In addition to voluntarily disclosing their EEO-1 employment data, American Water also shares that they audit pay gaps and pay equity annually. Their report covers highlights of the company's actions to close pay gaps by improving their programs to attract, reward, retain, and develop a diverse employee population.

2021 Inclusion, Diversity & Equity Report
A look at our diversity
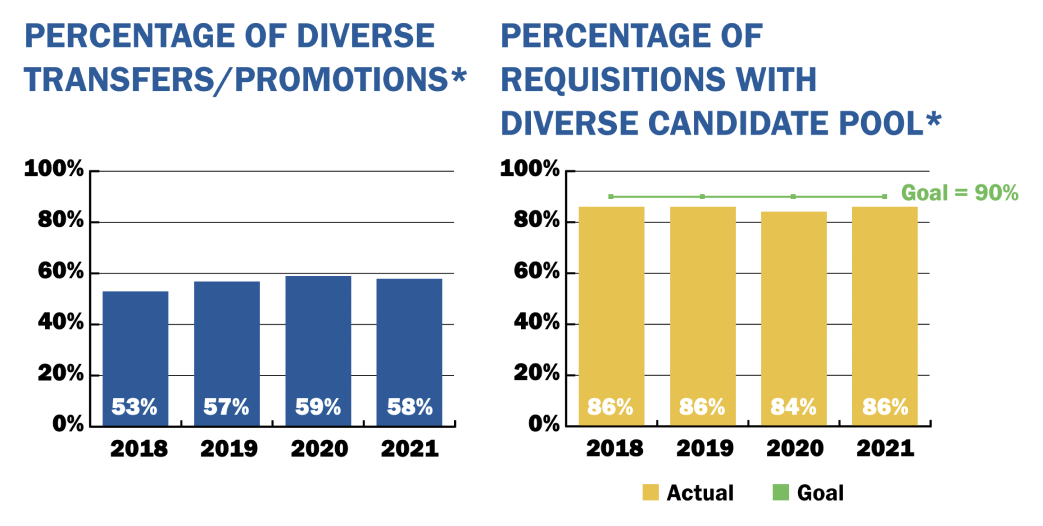
Below is a closer look at the percentage of diverse transfers, promotions, and new hires by category who have voluntarily self-identified.

Diversity metrics: Women
Female employees by ethnicity, race, and career level
A diverse workforce from different perspectives
Diversity of our workforce is important as we evaluate generations and tenure.
By tenure

Employee size: 25,000+
Industry: Professional Services
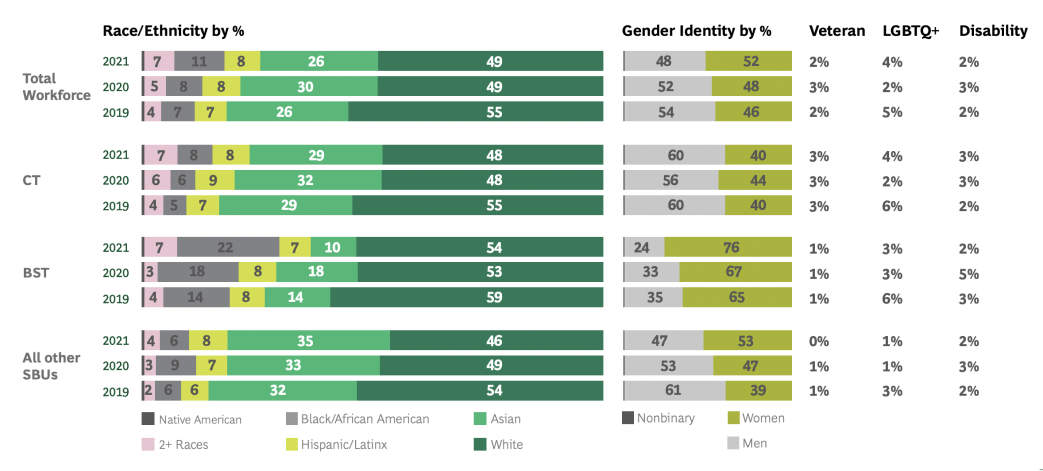
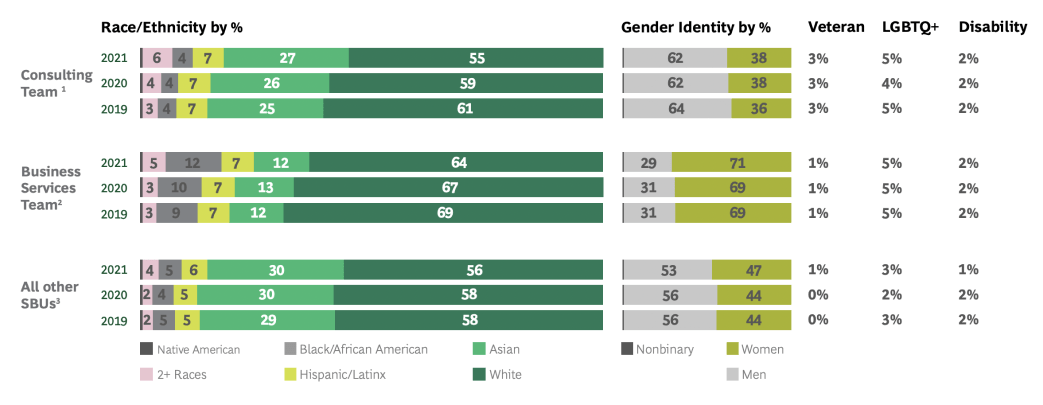
What stands out: Thorough charts sharing 3-year overall and new hire representation for a range of employee demographics.
BCG's Diversity Equity Inclusion US 2022 Report manages to pack a lot of information into data visualizations that convey their overall and new hire representation. Their report goes deeper than just reporting on gender and ethnicity to include veteran status, LGBTQ+ identity, and disability with comprehensive charts that stack results from the past three years.
Other highlights: BCG's report a shares growth rate increases for new hires and includes charts that show intersectional representation. The report also provides a narrative around ways that BCG is working to retain and advance underrepresented groups by promoting equitable practices in onboarding, performance management, and talent development.

2021 Inclusion, Diversity & Equity Report
Our intersectional representation
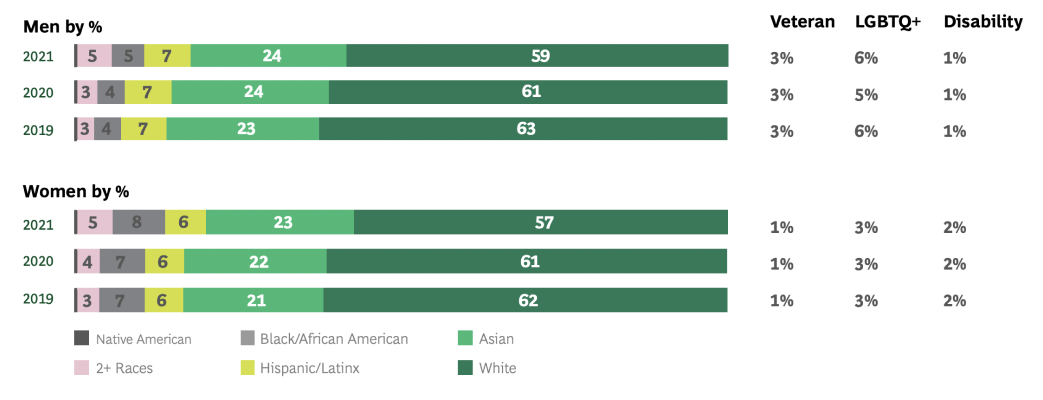
Our new hires
Our intersectional representation
We studied representation and hiring data in three categories, analyzing our workforce across: Core Consulting Team (CT), Business Services Team (BST), and additional organizations and specialty business units (SBUs).


Our intersectional representation
We celebrate the progress we are making in increasing our firm's diversity, and we know that hiring is a key component of that. We are committed to continuing to hire diverse students and professionals to accelerate these gains.

Employee size: 63,000+
Industry: Finance
What stands out: A detailed, data-backed narrative around both pay equity and opportunity equity (i.e. the raw median pay gap)
American Express achieved 100% pay equity across gender globally and across race/ethnicity in the U.S. in 2020 — and has maintained this goal since. In their 2020-2021 Environmental, Social, and Governance Report American Express shares details of their pay equity analysis processes, and discloses their raw median pay gap for women globally and for diverse employees in the U.S. In addition to a table showing their 2020 hiring, promotion, and retention rates, the report also provides a narrative around the processes in place to improve the inclusivity of American Express' hiring, interview, and professional development practices.
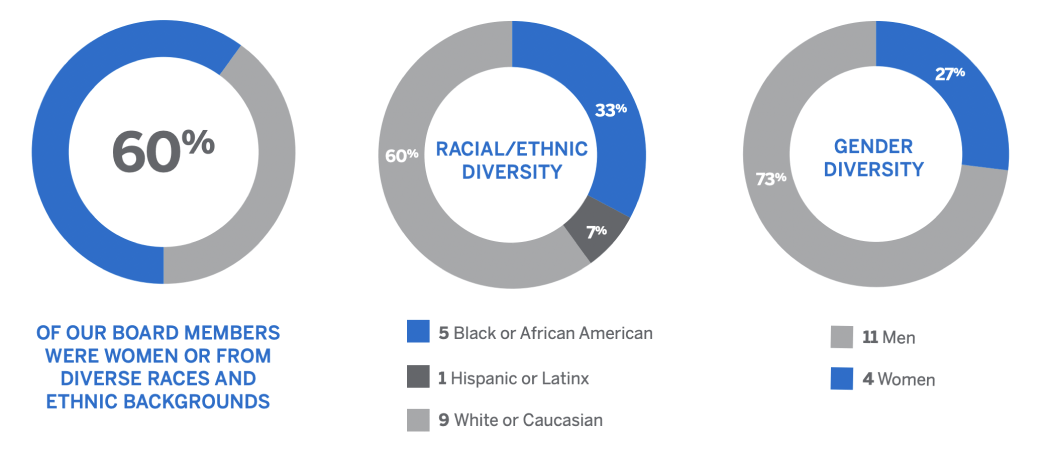
Other highlights: With clean graphics, clear charts and tables, custom illustrations, and quotes throughout, this report serves as an example of how to build a strong workplace equity narrative within your ESG disclosures. It includes charts and tables showing demographics and representation for their global workforce, U.S. workforce, board of directors, and executive committee by race and gender. The report also voluntarily discloses a summary table of their 2020 EEO-1 data.

The Powerful Backing of American Express: 2020-2021 Environmental, Social, and Governance Report
Board of directors demographics
2020 Senior vice presidents and above

2020 Global gender diversity

2020 Hiring, promotions, and retention rates

Maintaining pay equity

In 2020, we achieved 100% pay equity for colleagues across genders globally and across races and ethnicities in the United States. We are committed to maintaining this goal going forward.
At American Express, we strive to treat everyone who works for us fairly and equally. We have a longstanding commitment to pay all colleagues equitably and maintain bias-free, transparent compensation practices, and we are proud of our leadership in this area.
Our compensation practices reward colleagues based on performance and other business-related criteria for all roles and levels, and we have policies and processes in place to compensate all colleagues fairly and free of biases. We review these practices regularly, and since 2017 we have also worked each year with independent experts to conduct a pay equity review. Since 2019, this analysis has covered our entire global colleague base across genders globally and across races and ethnicities in the US, assessing pay on a statistical basis and considering key factors that influence compensation, including but not limited to tenure, role, level, geography, and performance.
In the past, we aimed to achieve pay "parity"-meaning to the point of statistical insignificance-to ensure colleagues are paid fairly, relative to one another. In 2019, we reached that goal, making salary adjustments in targeted areas where needed. Although pay parity is a meaningful achievement, we wanted to set an even higher standard for ourselves: to reach 100% pay "equity"-meaning no statistical differences-for all genders globally, as well as for colleagues of all races and ethnicities in the US. In 2020, we invested in all necessary and appropriate salary adjustments to reach our goal of 100% pay equity. We are proud of this achievement and are committed to maintaining this goal going forward.
In addition, we are also enhancing transparency by sharing the "raw median pay gap" for women globally as well as for diverse colleagues in the US. This metric compares differences in raw median base pay making no adjustments for factors such as role, level, tenure, performance, or geography. In 2020, the median pay for women globally at American Express was 107.6% of the median pay for men, and the median pay for US racially/ethnically diverse colleagues was 94.6% of that for white colleagues.
We believe our pay equity review provides a more accurate and comprehensive picture of our compensation practices overall because it provides a more granular view that considers many important factors known to affect an individual's compensation. For this reason, we use pay equity as the standard we hold ourselves accountable to in order to confirm that our compensation practices and reward structure are free of bias.
We remain committed to maintaining 100% pay equity for colleagues across genders globally and across races and ethnicities in the US by continuing our annual pay equity review process going forward.

Employee size: 25,000+
Industry: Professional Services
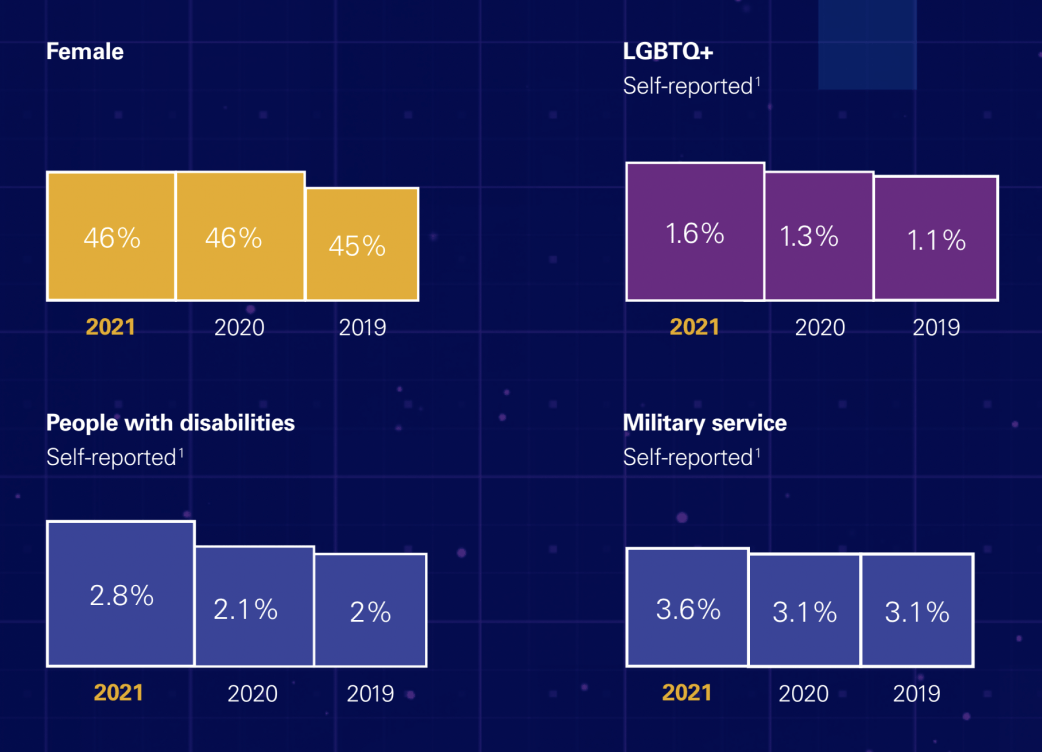
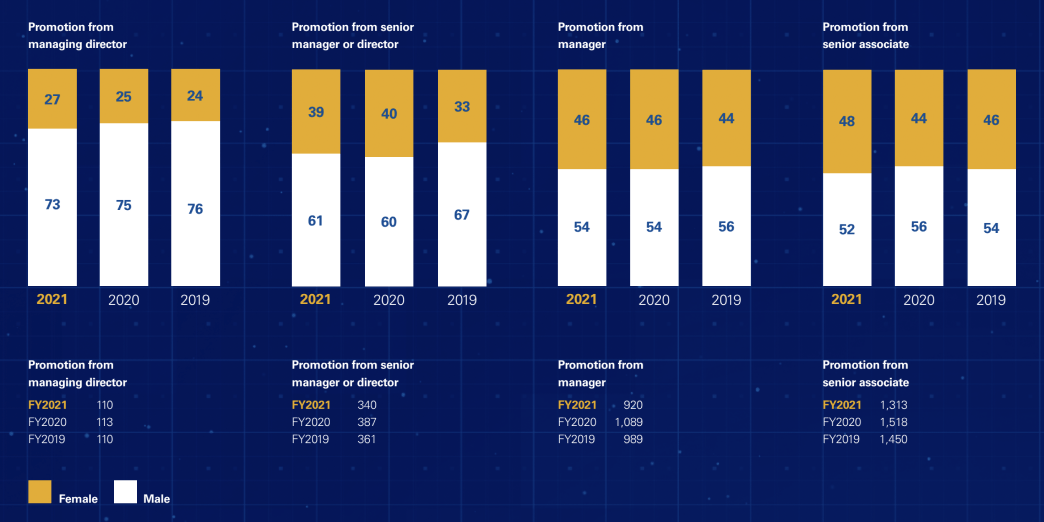
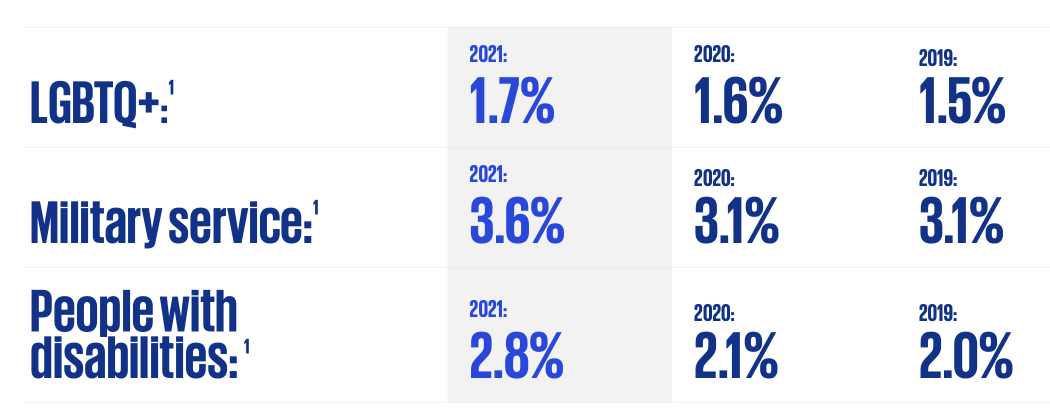
What stands out: Detailed data visualizations of 3-year data for gender, ethnicity, disability, LGBTQ+, and military status for both leadership representation, hiring, and advancement
KPMG's Diversity, Equity, and Inclusion: 2021 U.S. DEI Transparency Report and U.S. Impact Plan '22 report share in-depth diversity data on representation, hiring, and advancement for a range of employee demographics beyond gender and ethnicity, including disability, LGBTQ+, and military status. The reports visualize data trends over a three-year period, transparently showing where progress is being made and where there is work to be done.
Other highlights: In both its DE&I report and ESG report, KPMG shares actions it is taking to further its commitment to pay equity through annual benchmarking, not asking for compensation history, providing recruiters with salary ranges, and continual compensation process evaluation. The company also shares its multi-dimensional approach to developing a diverse talent and leadership pool.
Who we are
Advancement
KPMG's commitment to pay equity

 Our commitment to the principle of pay equity is deeply embedded in our Values and Culture. We examine the compensation employees receive to evaluate whether they are paid competitively and appropriately. Employee pay is based on relevant factors such as skills, performance, job responsibilities, level of experience in role, and applicable geographic and market considerations."
Darren Burton
Vice Chair - Human Resources
he/him/his
KPMG has pledged its commitment to the Gender and Diversity KPI Alliance. The alliance is committed to advancing women and underrepresented groups in the workplace and ensuring pay equity.
To further its commitment to fair and equitable pay, the firm:
- Engages in annual benchmarking of salaries in businesses and industries in which we compete for talent, which helps inform salary ranges, and considers competitive developments as to geographic markets, industries, and in-demand skills in assessing compensation.
- Does not ask applicants for compensation history
- Provides recruiters salary ranges to serve as a framework when developing and extending offers to candidates.
- Continually evaluates its processes to further identify ways to promote competitive and equitable compensation.
- Embraces a heads-up Culture and encourages employees to speak up if they have questions or concerns.
Women in manager roles and above


Equity
We use an independent third party to review our gender pay equity. In our most recent review, we have global gender pay equity and our global pay equity ratio between men and women is 1:1.
How do we define pay equity?
Compares what women are paid versus their similarly situated male coworkers, "controlling for" or "statistically adjusting" for factors such as job, seniority, and geography. Often referred to as "equal pay for equal work."
Promotion rates
We continuously assessed our annual promotion rates for women and URMs and found no statistical difference in the promotion rates across the groups.
Learning and development
We will invest in learning, Growth and Development, Internal mobility, Coaching, Sponsorship with a lens on diversity-measuring the learning and development gap.
04Using multiple formats for different audiences
Leading brands are sharing workplace equity information across multiple content formats that serve different audiences and purposes. Different stakeholders have different reasons for wanting to see your company's workplace equity information. It's beneficial for companies to use a variety of channels and formats to convey their messages to ensure they can reach the broadest audience. While long-form content such as ESG and DE&I reports are valuable to those looking for in-depth information, shorter formats that share highlights and snapshots — such as blog posts, videos, and infographics — are more accessible to the public.
Don't assume all audiences have the same understanding of the nuances of workplace equity terms and concepts; we've come across great examples of companies who define terms such as pay equity compared to the median pay gap upfront in their workplace equity communications.
 We've had candidates say 'I was deciding between you and another firm and when I heard about your stance on pay equity I decided to join you.' Also, I can't tell you how many emails I've received from current employees saying 'great to see Micron taking a leadership position here; I'm proud to work for an employer that's attained pay equity in not only gender, but all these other areas that we've done'."
Athar Siddiqee
Micron
Employee size: 282,000+
Industry: Tech
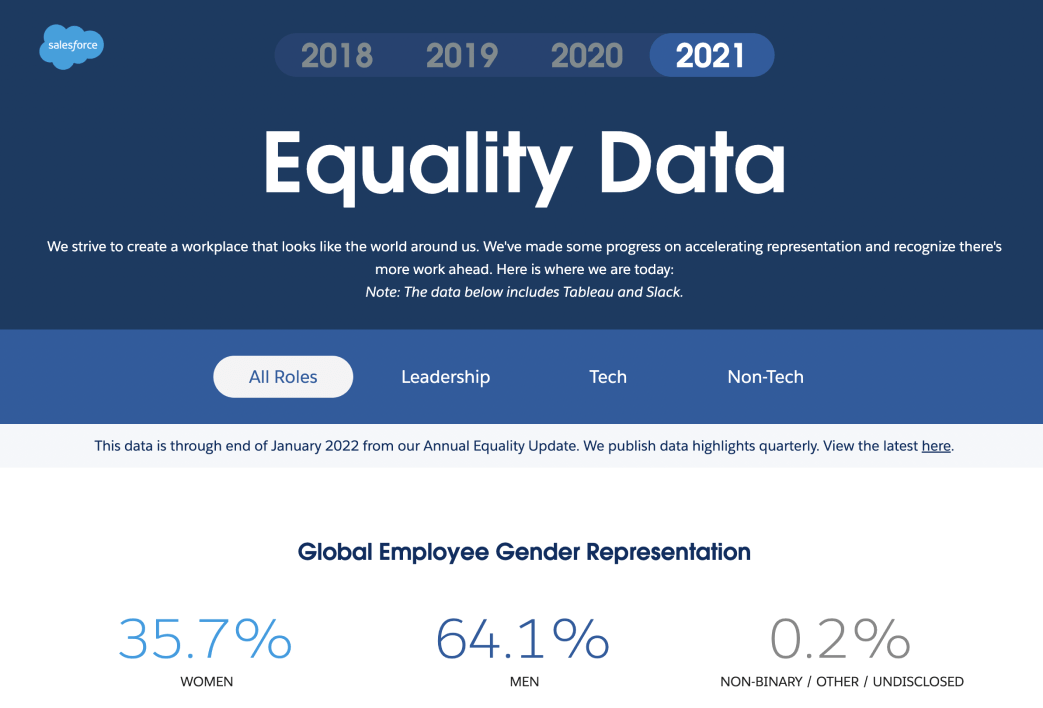
What stands out: Interactive data viz webpage providing easy exploration of equality data, blog post presenting a digestible summary of progress highlights, and equality webpage serving as a job candidate recruitment tool.
Rather than a pdf report, Salesforce presents their annual equality data in an interactive, digital data visualization page. This page makes it easy to explore four years' worth of representation data as well as reading about areas of progress and opportunity for improvement. They provide transparency into their equal pay strategy with a dedicated article describing the company's pay assessment process. Salesforce also presents a summary of their equal pay approach in a digestible blog post. And finally, a thorough equality webpage with data visualization, videos, and narratives serves as a powerful recruiting tool by showcasing Salesforce's actionable commitment to equality for all employees.
Other highlights: Salesforce serves as a great case study in how clear and accessible workplace equity communications can impact employer brand reputation. The company's public commitment to workplace equity has contributed to numerous employer accolades, including Fortune's 100 World's Most Admired Companies 2022, Fortune's 100 Best Companies to Work For 2021 (#2), 100% Score on the 2022 Corporate Equality Index by the Human Rights Campaign, and Glassdoor's Employee's Choice Best Places to Work 2022.
2022 Equal Pay Update: The Salesforce Approach to Pay Fairness

In 2015, we were one of the first companies to evaluate whether there were any gaps in pay among our global workforce. Such a simple idea - equal pay for equal work. At the time, it was pretty progressive, but since then more companies have joined us in committing to equal pay.
We're glad to see the progress we've made as an industry but, as we know, there is no finish line when it comes to equality. Equal pay should be table stakes and as expected as an earnings call or an annual report, which is why we've incorporated it directly into our annual compensation process.
Early on in our equal pay journey, we learned that you cannot fix it once and move on. Many factors contribute to pay inequality. When you acquire companies you also acquire their pay scales. Market dynamics, like higher inflationary times and competition for talent, can affect it too. So that's why we audit for equal pay every year and adjust as needed.
Brent Hyder
President & Chief People Officer

Employee size: 8,000+
Industry: Real Estate
What stands out: Data viz webpage and careers page illustrating pay equity and representation data highlights for employee and job candidate audience, as well as ESG report breaking down data for investors
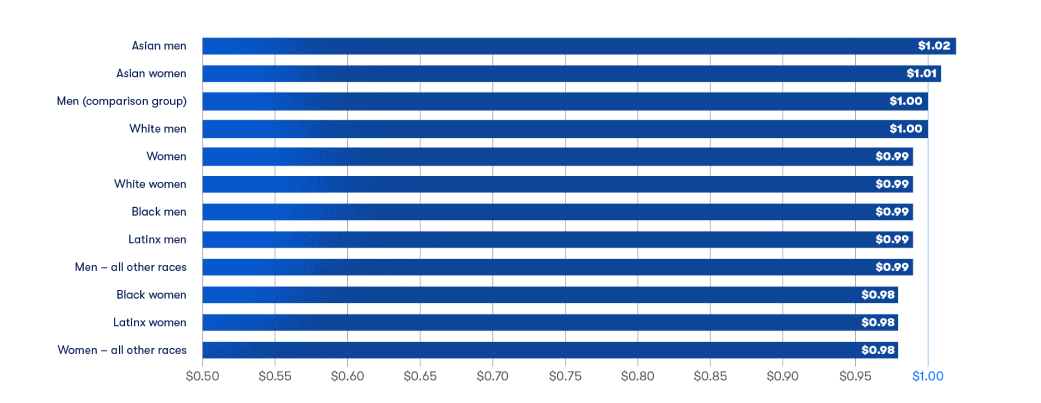
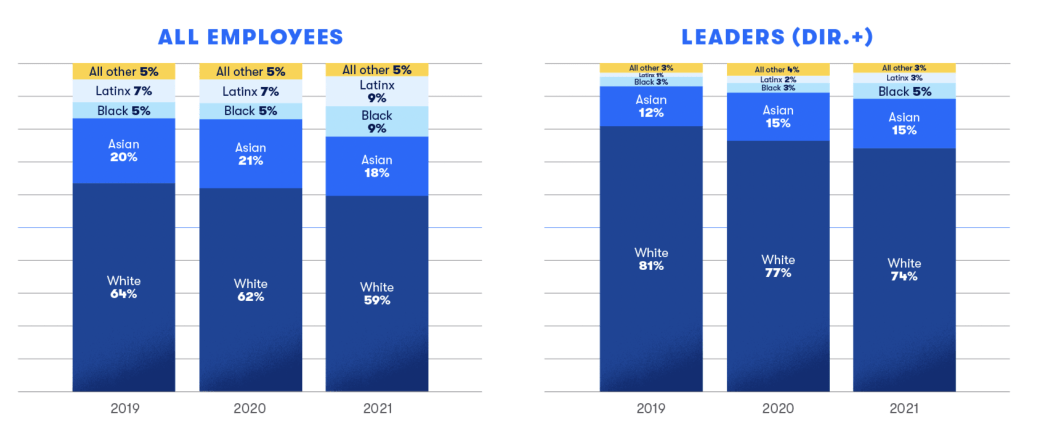
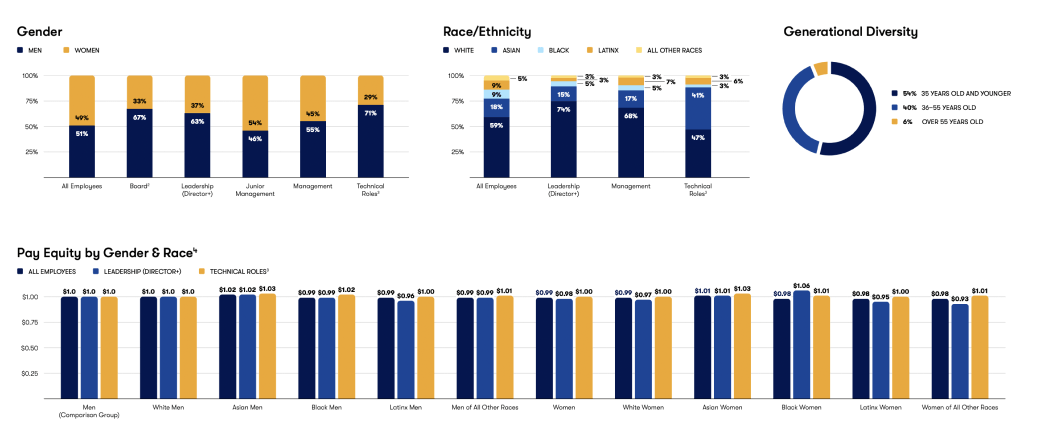
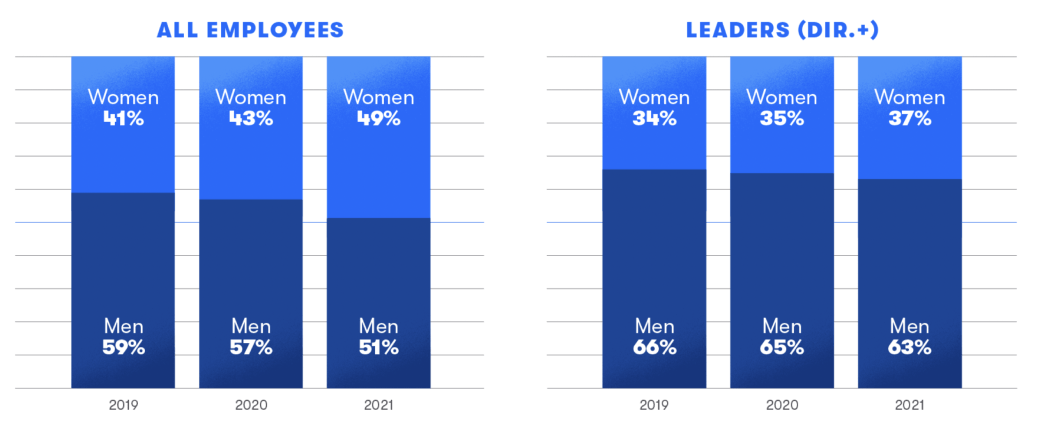
Zillow's pay equity and representation data visualization webpage provides one of the most clear charts we came across depicting "cents on the dollar" pay gaps for overall gender and for intersections of race and gender. This webpage is a great example of breaking out highlights of workplace equity data in an accessible format, with a contextual narrative explaining the reasons behind certain data trends. Their 2021 ESG Report provides deeper data insights for investors to show pay equity by race and gender across all employees, leadership, and technical roles. They also provide this data on their recruiting-focused Equity & Belonging Careers Page.
Other highlights: Zillow serves an example of how making and communicating about workplace equity progress can boost employer brand reputation, having been recognized as a Fortune 100 Best Companies to Work For 2021, Time's 100 Most Influential Companies 2021, HUman Rights Campaign's Best Place to Work for LGBTQ+ Equality 2022 and 100% Corporate Equality Index, and named to Bloomberg Gender-Equality Index 2022.
Pay equity at Zillow Group
Ethnicity at Zillow Group
2021 Equity & belonging data
Gender at Zillow Group

Employee size: 117,000+
Industry: Retail
What stands out: DE&I report, People Data data viz webpage, and a webpage dedicated to equal pay demonstrating a data-backed commitment to equity.
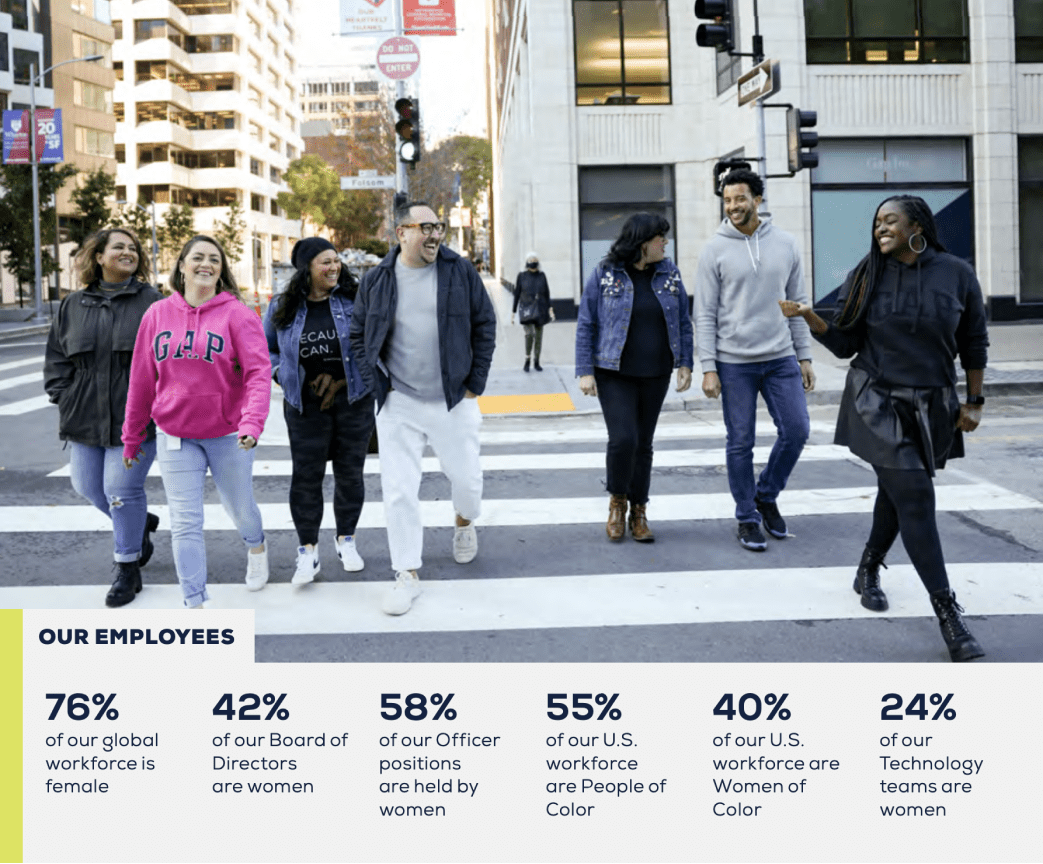
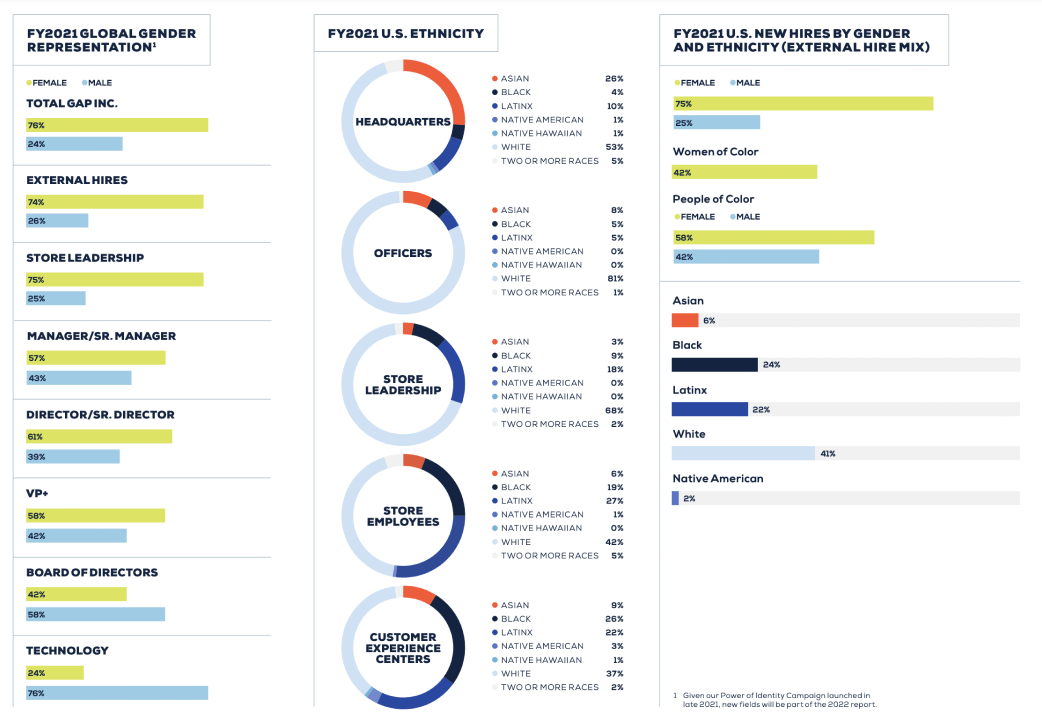
Gap creates a through-line theme of equity in multiple content formats, including a webpage dedicated to equal pay, a People Data data viz webpage, and a DE&I report. Their data viz webpage presents representation data for gender and ethnicity across leadership and new hires in clean, simple, easy-to-understand charts, while their DE&I report goes more in-depth into the data, as well as adding brand personality through employee quotes, photos, and an overall narrative around the progress Gap is making to create a more fair, equitable workplace.
Other highlights: Gap also shares progress around specific workplace equity goals in their investor-focused ESG report. The company was named the most #1 diverse and inclusive organization in Refinitiv's 2021 D&I Index.
Equal Pay For Equal Work
Gap Inc. pays women and men - globally, dollar for dollar - equal pay for equal work. In 2014, Gap Inc. was the first Fortune 500 company to announce equal pay for equal work, with its methodology and data independently validated by a leading gender and diversity firm. Gap Inc. conducts annual internal pay equality reviews using this approved methodology.

 Our Founder On Equal Pay
I would have always assumed that women were getting paid the same amount as men. But, back when we started Gap, of course they weren't. That was a time when I don't think it occurred to many people that women could be leaders. There were so few women leaders back then. It's just the way the world was. It's different now. I hear about women as CEOs and Presidents of companies, and I'm glad to know things have changed."
Doris Fisher
Ethnicity

Gender

Equal Pay For Equal Work
Gap Inc. pays women and men - globally, dollar for dollar - equal pay for equal work. In 2014, Gap Inc. was the first Fortune 500 company to announce equal pay for equal work, with its methodology and data independently validated by a leading gender and diversity firm. Gap Inc. conducts annual internal pay equality reviews using this approved methodology.
05Reflecting your brand personality in your workplace equity narrative
Companies are letting their brand personality shine through in their workplace equity communications. Rather than viewing workplace equity transparency as a dry reporting exercise, consider it an opportunity to further your overall brand story and communicate the heart of your vision and values. Nearly every company says they value their employees, but companies who create a program to measure workplace equity metrics, take action to drive progress, and then report transparently can prove that they do.
Through creative visuals and messaging that is cohesive with your brand voice at large, workplace equity communications can serve as an extension of your brand narrative while also demonstrating quantifiable progress to stakeholders. Being authentic, honest, and even bold in your messaging matters as well. One important component of this is showcasing the real people at your company who are passionate about, advocating for, and driving progress around workplace equity, and not being afraid to take a stand and have a company perspective on workplace equity issues.
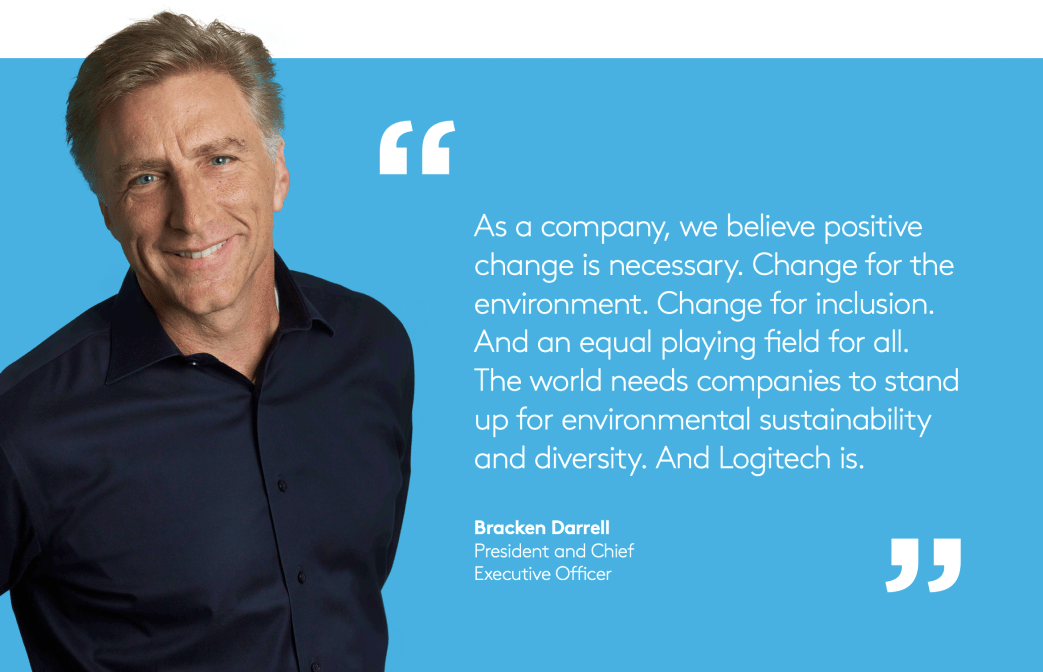
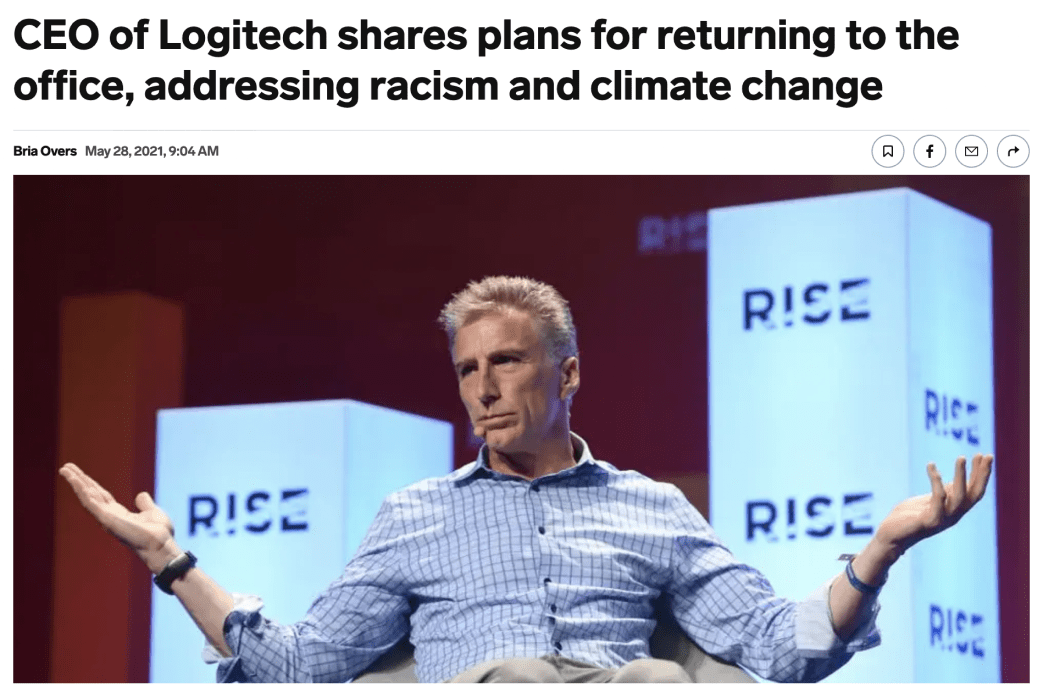
 We will not be afraid to act for fear of reprisal or provocation. When we err, we will apologize, correct if we can, and work to be better. Ultimately, this is about accountability and action for Logitech. We pledge to make diversity a priority and be transparent and accountable for where we succeed and fall short."
Bracken Darrell
CEO
Logitech

Employee size: 8,000+
Industry: Tech
What stands out: With a CEO outspoken about his emphasis on DE&I — and actions backing their commitment to progress — Logitech has created a brand as a company with a strong perspective on equity.
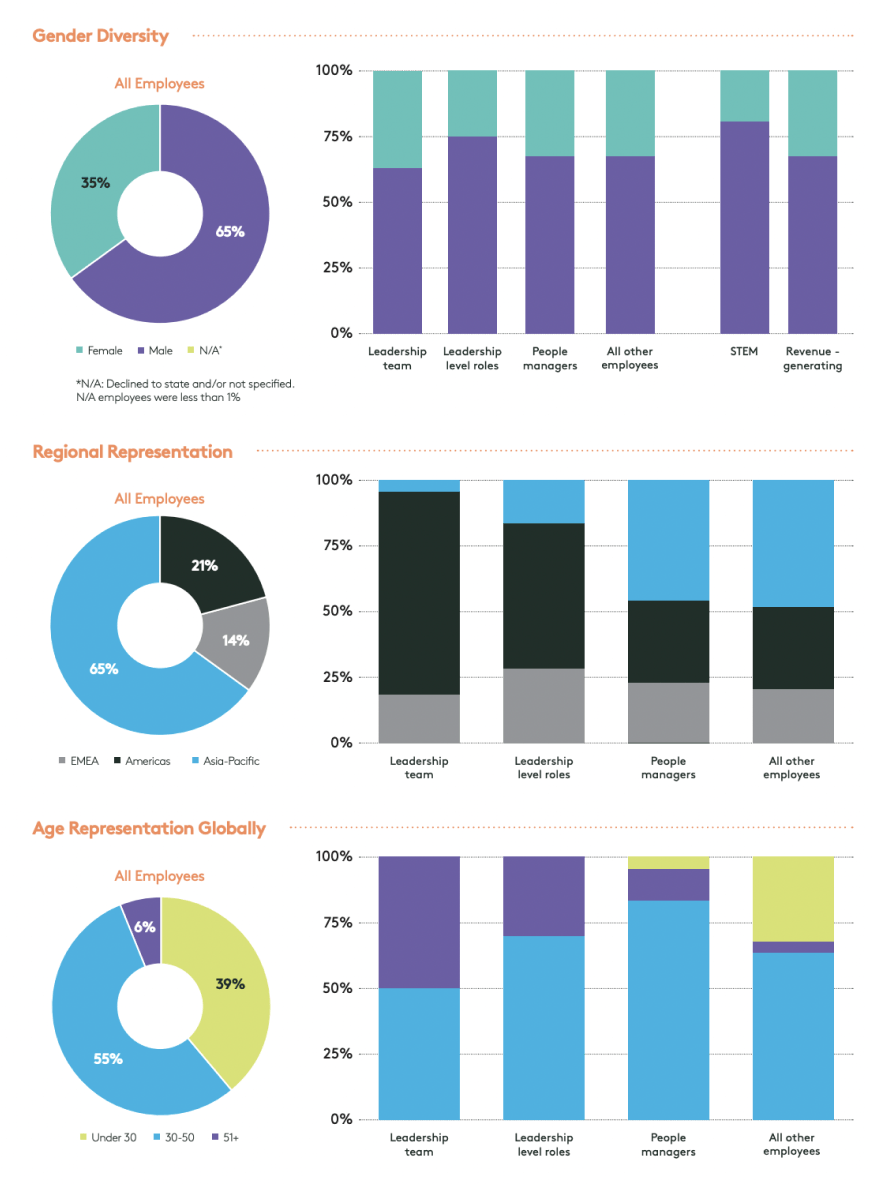
Logitech's FY21 Sustainability Report combines beautiful design and visuals to connect the dots between Logitech's company vision and their action plan for achieving their social impact goals around diversity, equity, and inclusion. The report provides charts illustrating the current state of representation at the company broken down by race/ethnicity and gender, including charts that visualize the intersectionality of representation by job level, gender, and race/ethnicity. Logitech provides some visibility into their pay equity process and annual compensation review, and describes the company's belief in equal access to opportunity.
Other highlights: The report outlines Logitech's initiatives and commitments related to improving diversity and inclusion within their business practices, supply base, communications, employees, and products. It also provides the company's overall inclusivity score. Logitech's CEO Bracken Darrell is an outspoken advocate for corporate accountability and action around diversity, inclusion, and the role companies must play in combating systemic racism and bias.

Sustainability Report FY21
Reflecting on Sustainability at Logitech
This is Logitech's 40th year, and our purpose has never been stronger or clearer - to enable people to pursue their passions by designing experiences so that everyone can create, achieve, and enjoy more. We are committed to doing this in a way that is good for the planet.
Two values in our company culture were propelled to prominence in 2021: equality and environment. They are core to what we want to be and they drive our actions daily. In a year when environmental and social issues became undeniable, we strengthened our commitments and took their implementation far further than we had ever done so before.
Equality
We are taking action to address the need for a more diverse, equitable, and inclusive society. We have outlined a seven-point plan to address injustice and create a more equitable world. Diversity, Equity and Inclusion (DEI) plans and goals are in place and we are actively cultivating a culture of inclusive leaders who work together to ensure that employees, suppliers, partners, and customers feel supported, and are part of a thriving, diverse community.
We created a Supplier Diversity Program, increasing the number of suppliers from underrepresented communities by 30% this year. We established a LogiCares Donor Advised Fund for charitable giving, to accelerate the pace of social change.
We know we cannot drive change alone and are working with innovative partners to solve society's toughest problems. We are only just getting started.
The sustainability standards set forth in the Responsible Business Alliance (RBA) Code of Conduct have guided us for well over a decade. We continue to hold ourselves accountable to the highest environmental, social, and governance standards in the industry and we are committed to the United Nations Global Compact and the Sustainable Development Goals (SDGs). With these commitments, we are pursuing opportunities to solve social and environmental challenges, protect our planet for future generations, and fight inequality and injustice

Employee size: 10,000+ (in UK)
Industry: Manufacturing
What stands out: Workplace equity communications are aligned around a cohesive theme, backed by clearly presented representation data and enhanced with employee photos and quotes throughout.
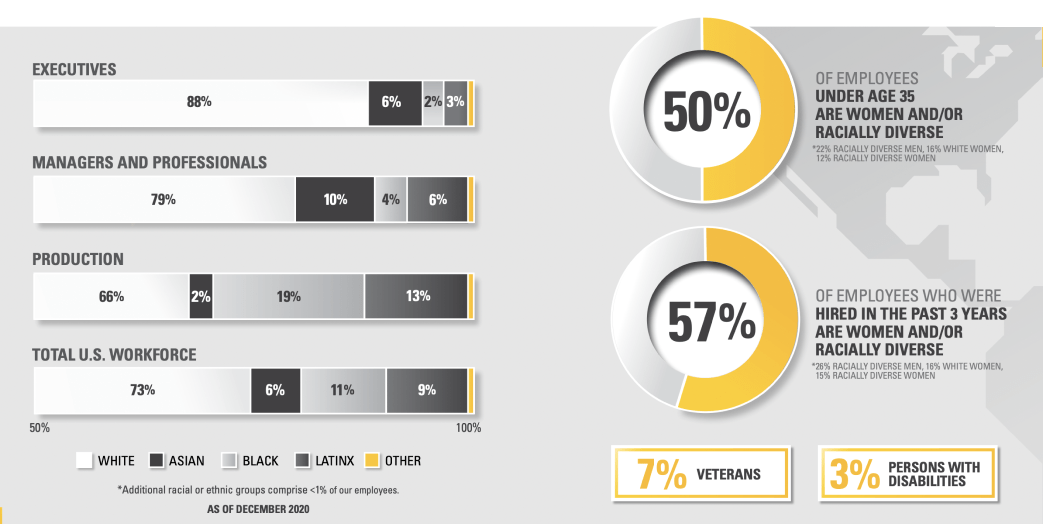
Throughout their workplace equity communications, Caterpillar creates a strong narrative around their D&I tagline, "The Power of Everyone". Their Diversity and Inclusion Report is beautifully designed with branded graphics, creative data visualizations, and employee quotes and photos throughout. A video on Getting Candid About What Matters: Inclusion at Work showcases employee voices and perspectives on Caterpillar's inclusion journey.
Other highlights: Caterpillar's D&I page focuses on how the company is "doing the work" to achieve their D&I goals, providing insight into their DE&I framework. Their workplace equity efforts have resulted in a strong employer brand reputation: Caterpillar has received recognition as Newsweek's Most Trusted Companies in America 2022, Fortune's Most Admired Companies in the World 2022, Forbes' Best Employers for Diversity in America 2021, Forbes' Best Employers for Veterans 2021, and Savoy Magazine's Most Influential Black Board Members 2021.
US employee representation
Gender representation
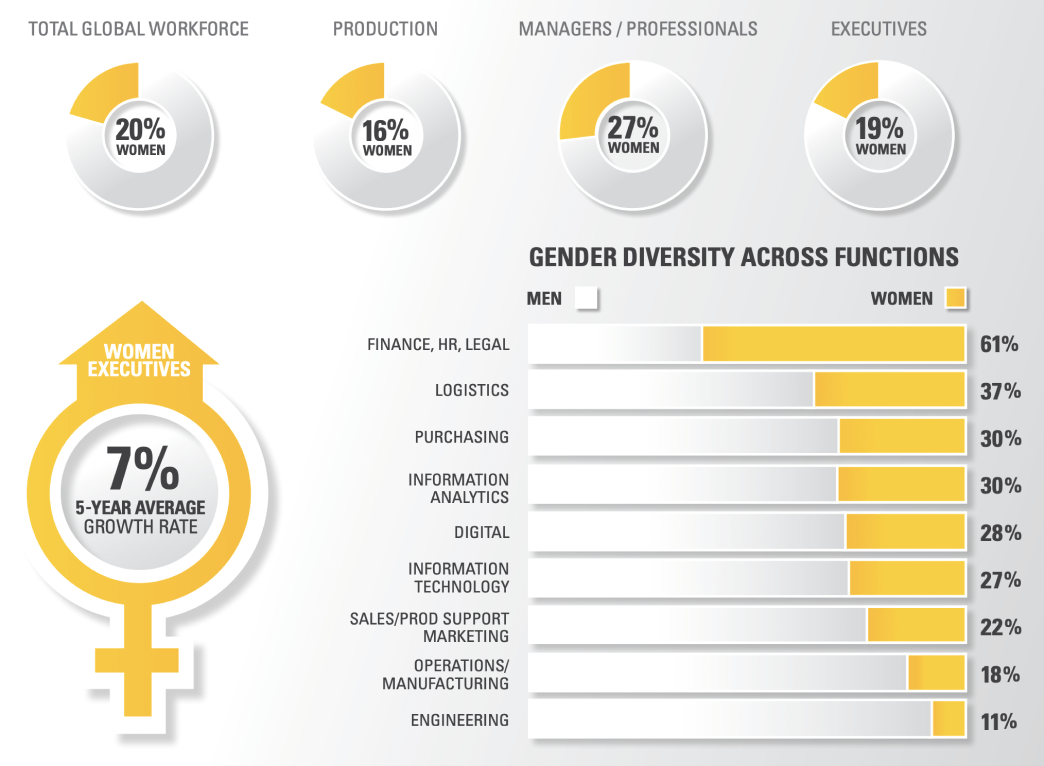
Since 2015, our global representation of women has increased to 20% from 18%, while the representation of women in leadership roles* has increased to 20% from 16%. We remain committed to achieving our aspirational goal of 29% global representation and 25% women in leadership roles.
Women represented in professional roles within our Legal, Finance and Human Resources corporate functions combined is 61%. We have also made important strides in technical roles in logistics, procurement, digital and IT where we are close to or exceed 30% female representation.
We continue to focus on improving representation in our manufacturing, sales, product support and engineering functions. We will achieve this through our ongoing commitment to providing development and career opportunities to retain our current talent.
To help us attract and hire more women, we will also continue to foster our long-standing strategic partnerships with organizations like the Society of Women Engineers.
Supporting women with programs, role models, mentors and peers, are all ways that we are working to help attract and retain talent at Caterpillar. We provide a wide array of health, wellness and support programs that address the full employee life cycle, from early career to retirement.
Our Women's Initiative Network is an integral part of that support system. It has more than 75 chapters globally, and has experienced a 200% growth in the last 5 years. Their active involvement in the networking, mentorship and crucial professional development is an important element of what helps drive success in the development and retention of our female workforce.
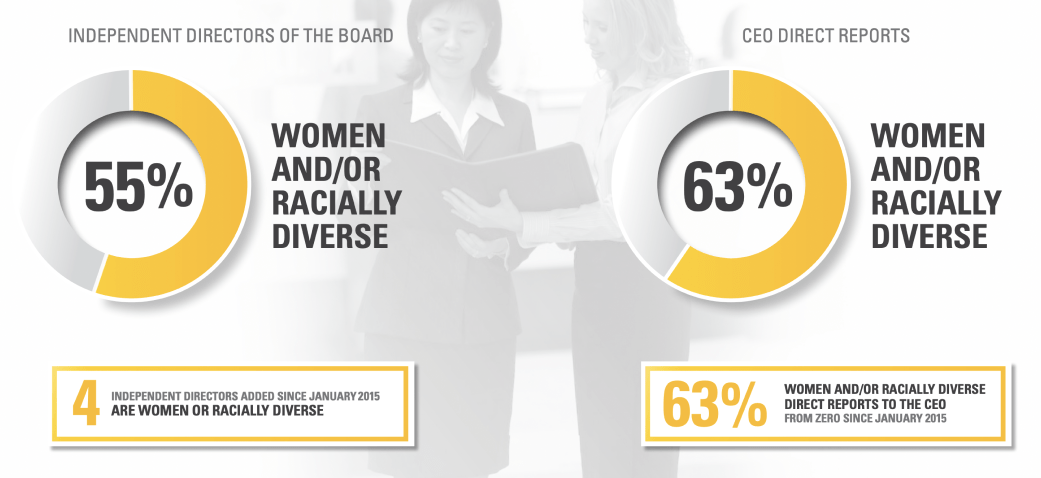
Our board of directors and executive office
06Earning external validation
Another way that workplace equity information reaches the public through neutral, third-party assessments. In some cases, companies proactively seek out external validation and communicate broadly when they reach a certain milestone, like achieving certification from Fair Pay Workplace. In other cases, companies may be rated on workplace equity and ESG efforts by third-party organizations like Arjuna Capital and Proxy Impact (Racial and Gender Pay Scorecard), CSRHub (ESG ratings), and Bloomberg (Gender-Equality Index), just to name a few.
 Fair Pay Workplace, the trusted symbol of pay equity around the world has certified Anthem, Inc. as a Fair Pay Workplace. Anthem has undergone a rigorous evaluation of its data and practices via a transparent set of rules and standards, and has committed to following a tailored action plan designed to support their ongoing progress."
Anthem
Fair Pay Workplace Certification
What stands out: Once certified, companies can communicate broadly about undergoing a rigorous evaluation of their pay equity data and practices.
As companies tackle pay equity in their overall workplace equity efforts, there's an increasing need and appetite across the board — from employees, investors, leadership — for a consistent, transparent set of rules and standards around fair pay. These standards are now a reality with Fair Pay Workplace, which certified its first cohort of organizations in September 2021: American Airlines, Anthem, Databricks, NerdWallet, Sellen Construction, and University of California, Irvine.
By partnering with Fair Pay Workplace to undergo a robust pay equity analysis and commit to an action plan, these companies can communicate with confidence — and a public stamp of approval that can be shared in press releases, webpages, and reports.

Employee size: 123,000+
Industry: Airline
American Airlines provides a strong example of how a Fair Pay Workplace certification can be used to back up your company's commitment to pay equity. Their ESG Report 2021 includes a section describing American Airlines' pay equity analysis process and methodology, as validated by their Fair Pay Workplace certification.
Building on a long-standing commitment to pay equity
American has long championed pay equity, and we were proud to sign the White House Equal Pay Pledge in 2016. Since then, we have continued to refine our efforts to identify and close pay gaps based on gender, race and ethnicity. The 86% of our workforce that is covered by collective bargaining agreements has built-in pay equity as part of those agreements. Therefore, we have focused on pay equity for the remaining 14%, made up of management and support staff, who do not belong to unions.
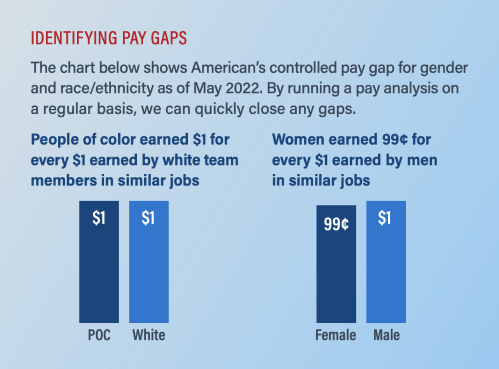
After engaging a labor and economics firm to support our pay equity analysis, American began deploying Syndio's workplace equity platform in 2020. Through Syndio's guidance, we fine-tuned our methodology and successfully completed pay equity reviews through 2021. Our approach begins by placing team members in one of 50 "similarly situated groups" (SSGs) across American based on the type of work they do. We then identify factors that can impact compensation within each SSG, such as an individual's seniority, experience or pay scale. Of course, higher salaries awarded to any new or existing team members can result in unintended pay gaps. By running a pay analysis at key points throughout the year, we can identify any drift in pay equity and address it. (See box at right.)
In 2021, American also became the first airline - and one of only a handful of large U.S. companies - to receive Fair Pay Workplace's inaugural pay equity certification. This Seattlebased nonprofit is working to dismantle pay disparities based on gender, race and ethnicity to create sustained fair pay. Our certification means that American has committed to apply valid methods for identifying pay equity issues and for implementing an ongoing remediation plan over time. As such, our rules and standards are available to the public.
The Fair Pay Workplace certification applies specifically to our management and support staff teams. Among our certification requirements, American will undergo regular check-ins that involve a seven-point review of our remediation plan. We have also pledged not to ask job candidates about their prior compensation or expectations for starting pay, which Fair Pay has identified as one of the largest sources of pay gaps.


Employee size: 98,000+
Industry: Healthcare

Inclusion & Diversity webpage
Pay equity
Anthem's commitment to offering all associates an inclusive environment and equitable opportunities to develop their careers and advance in our organization extends to our compensation philosophy and pay practices. The roles our associates play and their performance, experience, and geographic location-not gender or ethnicity-are what drive our compensation programs.
Anthem's being a leader in inclusion and diversity requires our sustained commitment and the willingness to challenge ourselves continually to find ways to improve. We are committed to pa equity for all associates. n 2020, we partnered with a third party to conduct a complex gender and race pay equity analysis. It confirmed that the roles our associates play and their performance, experience, and geographic location are the main predictors of pay. After accounting for factors such as age, performance rating, and level of education, the analysis found that pay for females and people of color is within 1 percent of that awarded to their male and white counterparts. To prevent unexplained pay gaps and ensure that we remain a champion of pay equity for all associates, we will continue to monitor our pay practices and diligently address any cases that cannot be explained by objective factors

What stands out: Once certified, companies can communicate broadly about undergoing a rigorous evaluation of their pay equity data and practices.
As companies tackle pay equity in their overall workplace equity efforts, there's an increasing need and appetite across the board - from employees, investors, leadership - for a consistent, transparent set of rules and standards around fair pay. These standards are now a reality with Fair Pay Workplace, which certified its first cohort of organizations in September 2021: American Airlines, Anthem, Databricks, NerdWallet, Sellen Construction, and University of California, Irvine.
By partnering with Fair Pay Workplace to undergo a robust pay equity analysis and commit to an action plan, these companies can communicate with confidence - and a public stamp of approval that can be shared in press releases, webpages, and reports.

Employee size: 181
Industry: Nonprofit

Fair Pay Workplace certification press release
Center for Internet Security earns Fair Pay Workplace certification
Certification requires companies to undergo rigorous analysis with standardized methodology
EAST GREENBUSH, N.Y., Jan. 19, 2022 - The Center for Internet Security, Inc. (CIS®) today announced it has been certified by Fair Pay Workplace (FPW), the trusted symbol of pay equity around the world. The company has undergone a rigorous evaluation of their data and practices via a transparent set of rules and standards, and has committed to following a tailored action plan building upon their fair pay practices.
"The human resources department and our leadership teams have historically worked closely together placing priority on pay equity across the organization," said Carolyn Comer, Chief Human Resources Officer at CIS. "I am incredibly proud to be a part of an organization that demonstrates a serious commitment to the importance of pay equity."
CIS's compensation philosophy is to provide a fair and industry-competitive total compensation program designed to attract, reward, and retain top talent. We are committed to providing employees with a competitive base pay, appropriate incentives, work/life balance, professional development opportunities, and a very attractive comprehensive benefits program.
CIS strives to make compensation decisions in a transparent and consistent manner. Base pay and salary increases are based on an evaluation of maintaining market competitiveness, internal pay equity for employees in similar roles at similar levels, and individual performance. Annual bonuses are based upon the accomplishments of the CIS team, while spot bonuses can be used to recognize extraordinary contributions by a team or individual.
"An across-the-board treatment recognizes that we are all one team that contributes to the growth and success of CIS," added Comer.
Employee size: 675
Industry: Finance

Diversity, Equity, and Inclusion Programs
Pay equity
Investment in true and ongoing pay equity is essential to our values at NerdWallet. We've taken this commitment to the next level with our certification by Fair Pay Workplace (FPW). Fair Pay Workplace is on a mission to eliminate pay disparities based on gender and race - a mission NerdWallet has supported since our inception in 2009 as part of our broader commitment to inclusion.
What stands out: Activist investor publicly grades companies based on quantitative pay equity disclosures.
Companies who put in the work to improve their pay gap and transparently disclose their pay gap progress can be rewarded with good press on third-party channels, boosting their brand reputation as an equitable employer.
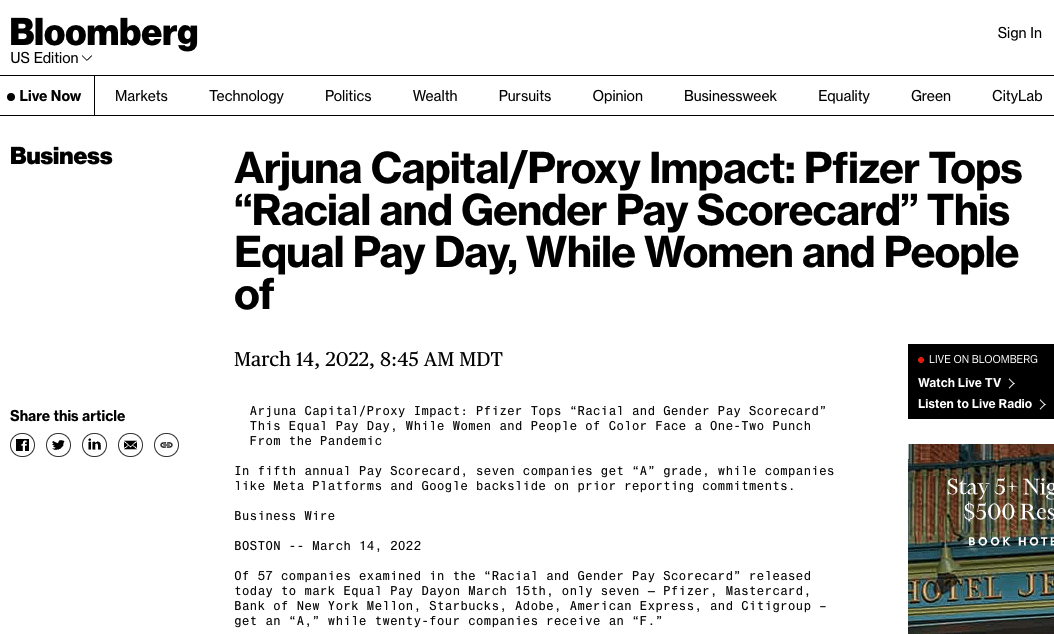
The Racial and Gender Pay Scorecard published by investment management firm Arjuna Capital and shareholder advocacy firm Proxy Impact ranks companies based on quantitative disclosures, performance, and commitments to action. Companies are graded on their racial pay gap, gender pay gap, UK pay gap, coverage, and commitment.
According to the scorecard, to receive an 'A' result "reflects not only a narrowing racial and gender pay gap, but also robust disclosure and commitment to improving the pay gap over time." The Scorecard recommends as a best practice that companies provide full disclosure of:
-
-
- Quantitative adjusted racial and gender pay gaps (i.e. measuring pay equity)
- Unadjusted median racial (U.S.) and gender (global) pay gaps (i.e. measuring opportunity equity)
- Pay components
- Percentage of employee base covered by analysis
- Methodology of pay gap analysis
- Policies and actions to address gaps.
-
The scorecard also recommends companies provide public commitment to: 100% pay equity, 100% global coverage of employee base in analyses, and annual disclosure of pay gaps.

2022 Racial and Gender Pay Scorecard
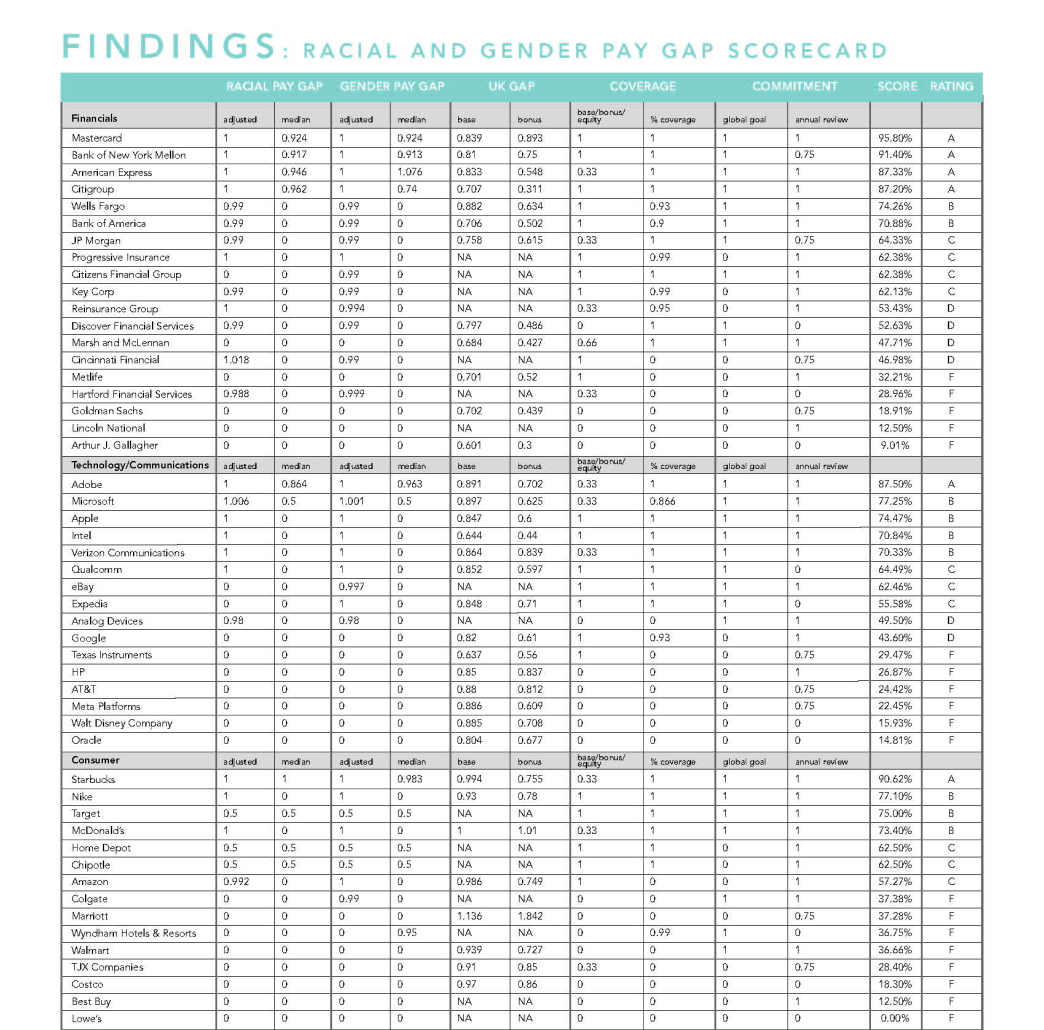
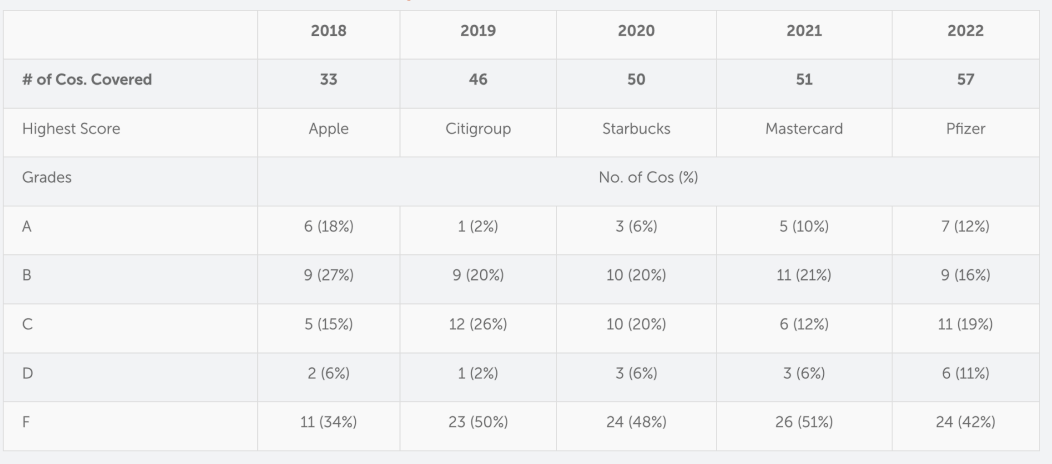
Since the first scorecard published five years ago, an "A" score has been awarded approximately 10% of the time, on average. An "F" score, however, has been awarded approximately 40% of the time, signaling that there is still room for improvement in pay equity analysis and reporting.
Historic results of racial and gender pay scorecard

Employee size: 79,000+
Industry: Pharmaceuticals

Employee size: 29,000+
Industry: Finance


